The Color of Governance: Seongnam FC and the Civic Club Shift

Walking through the streets of Seongnam on a Wednesday afternoon in April 2026, it is easy to spot the black jerseys of the local football club. For long time fans, this color represents more than just a fashion choice. It is a visual reminder of a massive shift in how a sports team can exist within a city. Before 2014, the team wore bright yellow and was known as Ilhwa Chunma. That version of the club was owned by a private corporation, the Tongil Group, which was affiliated with the Unification Church. Today, the club belongs to the city itself. This change was not just a branding exercise, it was a fundamental reorganization of the club’s legal and financial identity.

A Legacy of Private Success and Sudden Crisis

The history of the club is full of trophies. Founded in 1989, Ilhwa Chunma became a dominant force in Korean football. They won three consecutive league titles in the mid-1990s and another three in the early 2000s. In 2010, they even reached the top of Asian football by winning the AFC Champions League. However, this success was tied to the personal interest and financial backing of Sun Myung Moon. When he passed away in 2012, the club’s future became uncertain.

The Tongil Group began a restructuring process, and the family members in charge showed little interest in maintaining a professional football team. The threat of disbandment became a real possibility. This situation highlighted a major vulnerability in private ownership. If a single owner or a corporation loses interest or faces financial trouble, an institution that a community cares about can vanish overnight.

The Civic Mobilization and the 2013 Takeover

Faced with the loss of their team, the people of Seongnam took action. Fans, local officials, and even supporters of rival K League teams joined together to demand that the club be saved. This was a significant moment in Korean sports history. It was not just about keeping a team in the city, it was about proving that a sports club could be a public asset.

In late 2013, Seongnam City officially took over the club. The transition involved more than just changing the name to Seongnam FC. The club replaced its previous symbols with the magpie, which is the official bird of the city. The yellow uniforms were retired in favor of the current black and white kit. This transition turned the club into a “civic club,” a specific model where the local government acts as the primary owner.

How the Civic Model Functions

In a civic club model, the governance structure is quite different from a typical business. The Mayor of Seongnam serves as the representative owner. This means the club is essentially a public entity. Its operations depend on annual budget allocations from the city council rather than a private owner’s deep pockets.

This structure brings a high level of public accountability. Every won spent by the club is public money, which means the city hall provides close oversight. While this ensures that the club remains a part of the community, it also introduces bureaucratic hurdles. Decisions that might take a private owner minutes can take weeks when they have to move through government committees. Spending is often less flexible, and the club must justify its existence to taxpayers who might not follow football. This legal framework is a clear example of how legal structures shape user behavior and institutional decisions within the city.

The Binary Landscape of the K League

The K League is currently divided into two types of ownership. On one side, you have the corporate clubs, or “chaebol” teams. These are backed by massive conglomerates like Hyundai or Samsung. These teams often have larger budgets and more stability because they are part of a global marketing strategy. On the other side are the civic clubs, owned by local governments like Seongnam, Gwangju, or Suwon.

This binary system creates a unique competitive environment. Civic clubs often have to be more creative with their resources. They focus on local integration and developing young talent because they cannot always outspend the corporate giants. For Seongnam FC, now competing in the second tier, the focus is on building a sustainable path back to the top division. Fans who want to understand the current stakes can look at the 2026 K League 2 promotion and relegation guidelines to see how the club is managing its current resources.

The Consequences of Municipal Oversight

The move to a civic model changed the relationship between the fans and the team. Because the club is funded by the city, the residents feel a different sense of ownership. The team is no longer a marketing tool for a church or a company, it is a representation of the city’s identity.

However, the municipal framework also means the club’s fortunes can be tied to local politics. Changes in the city council or a new mayor can lead to shifts in the club’s budget or leadership. This creates a tension between the long term needs of a football team and the short term cycles of local government. Despite these challenges, the civic model saved professional football in Seongnam. It provided a template for how a community can step in when private interests fail.

A Public Institution on the Pitch

Seongnam FC stands as a case study in resilience. The club moved from being a private project to becoming a public institution. It survives not through the whims of a single corporation, but through the collective will of the city’s residents and officials. While the days of winning seven league titles might feel like a distant memory, the current version of the club has a foundation that is arguably more stable because it is rooted in the city itself.

The story of the magpies is a reminder that sports teams are often more than just businesses. They are parts of a city’s social fabric. By choosing the civic model, Seongnam ensured that the cheers heard at the stadium today are for a team that truly belongs to the people who live there.

How Football Simulation Models Work — What Korea’s 77% World Cup Probability Actually Means

A figure of 77 percent sounds precise. It sounds like information. But understanding what a World Cup qualification probability actually represents — how it is generated, what assumptions sit behind it, and why two credible outlets can produce radically different assessments of the same team — is more analytically useful than the number itself.

Where the 77 Percent Comes From

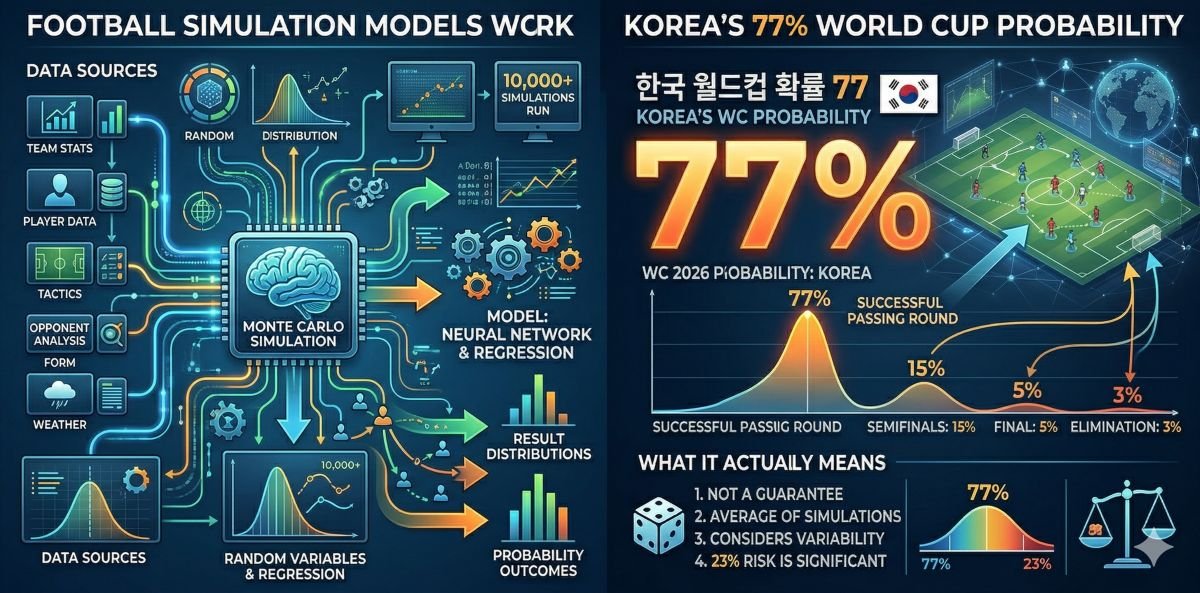
Football Meets Data, a soccer statistics media outlet, released simulation results showing South Korea has a 77 percent chance of advancing from Group A at the 2026 FIFA World Cup. Mexico leads the group at 90.3 percent. The Czech Republic sits at 55 percent and South Africa at 23 percent. Korea’s expected average points total across the group stage is 4.5, with the most likely individual outcomes being one win and two draws for five points, or one win, one draw, and one loss for four points.

These figures did not emerge from expert judgment or a single calculation. They are the output of a simulation model run across thousands — often tens of thousands — of individual tournament iterations. Understanding that production process is the starting point for interpreting the result correctly.

How Football Simulation Models Actually Work

A football simulation model begins with team ratings. These ratings attempt to capture the overall quality of each team using historical match results, recent form, the strength of opponents faced, home and away performance records, and sometimes player-level data aggregated to the squad level. The rating system itself varies between providers — some use Elo-style systems that update continuously after each match, some use FIFA rankings as an input, some build proprietary models that blend multiple data sources.

Once team ratings are established, the model generates a match probability for each fixture in the tournament. Given Korea’s rating versus Czechia’s rating, the model estimates a probability distribution across three outcomes: a Korea win, a draw, or a Czechia win. These are not equal probability events — the ratings difference between the teams shifts the distribution.

The simulation then runs the tournament thousands of times. In each iteration, it uses those probability distributions to generate random outcomes within the defined probability space. So if Korea has a 45 percent chance of winning, a 30 percent chance of drawing, and a 25 percent chance of losing against Czechia, the simulation does not predict a Korea win — it generates a random outcome weighted toward those probabilities, then moves to the next match and does the same.

After running 10,000 or 100,000 iterations, the model counts the proportion of simulations in which Korea accumulated enough points to advance from Group A. That proportion is the 77 percent figure. It does not mean Korea is likely to advance. It means that in 77 out of every 100 simulated versions of this group stage, Korea accumulated sufficient points to go through.

What 77 Percent Does Not Mean

The most common misreading of probability outputs is treating them as predictions. A 77 percent advancement probability does not mean Korea will advance. It means that under the model’s assumptions, the scenarios in which Korea advances are substantially more common than the scenarios in which they do not. But the 23 percent of simulations in which Korea fails to advance are still happening — and in any individual real-world tournament, only one outcome occurs.

Put differently: if you ran the 2026 World Cup Group A stage 100 times with these teams at these rating levels, Korea would advance in approximately 77 of them. But this tournament is run once. The 77 percent is a statement about a distribution of possible outcomes, not a forecast of the specific outcome that will materialize.

This distinction matters practically for Korean fans assessing the team’s prospects. A 77 percent probability is meaningfully better than even odds — it indicates genuine structural advantage. But it coexists with a 23 percent probability of group stage elimination, and nothing in the simulation guarantees which scenario applies to June 2026.

Why The Athletic and The Guardian Disagree So Sharply

The most revealing illustration of simulation model limitations comes from the divergence in how different credible outlets have assessed South Korea ahead of the tournament. The Athletic ranked Korea 16th out of 48 World Cup teams, predicting advancement to the round of 32 and suggesting a realistic path to the round of 16. The Guardian ranked Korea 44th — near the bottom of the entire field — citing recent performances including a 0-4 loss to Ivory Coast and a 0-1 defeat to Austria, and raising concerns about tactical vulnerabilities under coach Hong Myung-bo.

Both outlets are credible. Both are working from publicly available information about the same team. The gap between 16th and 44th is not explained by one outlet being right and the other being wrong. It is explained by a more fundamental issue: the inputs determine the outputs.

A model that heavily weights historical track record — Korea’s eleven consecutive World Cup qualifications, their semifinal finish in 2002, their round of 16 appearances in 2010 and 2022 — will produce a substantially higher rating than a model that heavily weights recent form. A team with Korea’s history but recent warm-up match losses looks very different depending on how far back the evaluation window extends and how much it discounts or emphasizes recent results.

Neither weighting choice is objectively correct. They reflect analytical assumptions about what information is most predictive of future tournament performance. A historically grounded model argues that recent form in March friendly matches is a poor predictor of June World Cup performance. A recency-weighted model argues that the current tactical and physical state of the team matters more than what they achieved years ago. Both positions have legitimate analytical basis.

How Korea’s Tactical Profile Creates Model Complexity

South Korea’s playing style introduces additional complexity into how simulation models capture team quality. Korea under Hong Myung-bo plays a high-energy, pressing-oriented game built around organized defensive shape and rapid transitions through Son Heung-min’s pace and directness. This profile is effective against certain opposition types and potentially vulnerable against others.

Simulation models that use aggregate team ratings do not necessarily capture this stylistic dimension. A model might rate Korea as a 22nd-ranked team globally without encoding anything about how their high press interacts with technically proficient possession teams, or how their counter-attacking threat changes the calculus against defensively deeper opposition.

Korea’s opponents in Group A — Mexico, Czechia, and South Africa — have notably different stylistic profiles. Mexico’s possession-oriented play, Czechia’s disciplined European structure, and South Africa’s physical directness each interact with Korea’s tactical identity in ways that aggregate ratings cannot fully model. Whether that creates upside or downside for Korea depends on assessments that simulation models can only partially incorporate.

Reading Probability Outputs as a Calibrated Fan

The practical skill that makes all other football analytics more useful is learning to read probability outputs as model-dependent distributions rather than as predictions. When you see a 77 percent figure, the analytically useful response is to ask three questions: What inputs drove this number? How does this provider weight historical versus recent performance? What would change about the output if those assumptions shifted?

Comparing outputs across multiple models — the Football Meets Data simulation, The Athletic’s power ranking, The Guardian’s assessment — and understanding why they differ tells you more about Korea’s genuine uncertainty than any single figure can. A team that ranks 16th in one credible model and 44th in another is a team with genuinely contested prospects, where the outcome depends substantially on which version of Korea shows up in North America this summer.

For deeper analytical context on why even strong teams produce surprising results and how probability and variance interact in competitive sport, 분산과 변동성 데이터의 흔들림을 이겨내는 법 provides directly relevant framing on navigating statistical noise in sports analysis. For a Seongnam-focused look at how these analytical concepts apply to evaluating football performance at the club level, 2026 K League 2 Promotion and Relegation: A Guide for Seongnam FC Fans demonstrates how probabilistic thinking applies to domestic Korean football contexts.

The 77 percent probability for Korea is a useful piece of information. It is not a promise, not a forecast, and not a substitute for understanding what it means to be a team with genuine advancement probability playing in a group where elimination is far from impossible.

What Expected Goals (xG) Actually Measures — and How It Changes the Way Football Analysis Works

Expected Goals has become the metric that separates surface-level match analysis from genuine performance understanding. With the 2026 World Cup approaching and Korean football media increasingly using xG as a standard analytical reference, understanding what the number actually means — and what it does not mean — has become a practical necessity for engaged fans.

The Problem xG Was Designed to Solve

Football is structurally resistant to straightforward statistical analysis. It is a low-scoring sport where a single deflection, a goalkeeper error, or a moment of individual brilliance can produce a result that bears no relationship to the quality of football played across 90 minutes. Traditional statistics — shots on target, possession percentage, pass accuracy — capture activity without capturing quality. A team can hit the target five times with speculative efforts from 35 yards and be credited with five shots on target alongside a team that created five clear one-on-one opportunities. The raw number tells you nothing meaningful about which team actually played better.

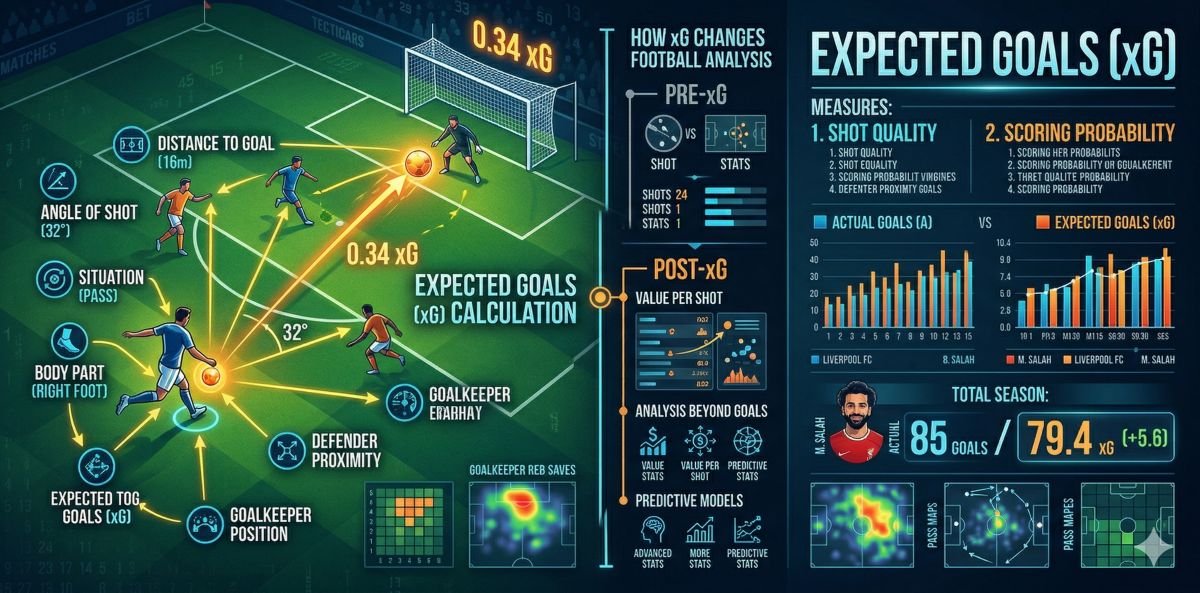
Expected Goals addresses this problem by assigning a probability value to every shot. Rather than treating all shots as equivalent events, xG asks a more precise question: given where this shot was taken, at what angle, with what body part, and following what type of pass — how often would a shot from these exact circumstances result in a goal?

How the Model Is Built

The xG value for any given shot is calculated by comparing it to thousands of historical shots taken from similar positions and circumstances. Every variable that affects scoring probability is fed into the model. Location is the most significant factor — shots from directly in front of goal within the six-yard box have very high xG values because they convert frequently in historical data. Shots from wide angles near the byline have very low xG values because the geometry of the goal makes scoring from that position statistically rare regardless of the quality of the individual striker.

Additional variables layer onto the location calculation. Headers have lower xG than shots taken with the foot from equivalent positions because they convert less frequently. Shots following a through ball have higher xG than shots following a crossed delivery because the attacking player is typically in a better position relative to the goalkeeper. Set piece situations are modeled separately because the defensive positioning differs from open play. Whether the attacking player was under pressure from a defender at the moment of the shot is incorporated in more sophisticated versions of the model.

The result is a number between zero and one. An xG of 0.93 on a tap-in from three yards means that kind of chance results in a goal 93 percent of the time in historical data. An xG of 0.009 on a long-range strike from outside the area means that type of shot goes in roughly once every 111 attempts.

What xG Reveals That the Scoreline Does Not

The interpretive value of xG emerges most clearly when the metric and the result diverge. A team that loses 1-0 while generating 2.4 xG against an opponent that generated 0.4 xG has not simply been unlucky. It has been structurally dominant in terms of chance quality and has been beaten by a combination of clinical finishing, poor conversion, or goalkeeping performance that outstripped what historical averages would predict.

This distinction matters enormously for evaluation over time. A striker who scores eight goals from a position where his xG total was 14 is not in good form — he is underperforming his expected output significantly. A goalkeeper who has conceded five goals against a combined opponent xG of 9.5 has been saving shots at a rate that historical data suggests is either excellent or unsustainable depending on the sample size.

For Korean fans following the national team’s build-up to the 2026 World Cup, xG provides a framework for understanding the ongoing discussion around Son Heung-min’s international scoring record relative to his club output. The question of whether Korea is creating genuine high-quality chances internationally — or whether the team is generating volume without quality — is precisely the kind of question xG is designed to answer with more precision than goals or shots alone can provide.

The Difference Between xG Providers — and Why It Matters

One source of confusion for fans encountering xG across multiple platforms is that the same shot can be assigned different values by different data providers. Sofascore and Sky Sports, for instance, may display different xG figures for the same event in the same match. This is not an error — it reflects the fact that different providers use different models with different variables and different historical datasets.

Some models include goalkeeper positioning as a variable. Others do not. Some use larger historical datasets spanning multiple leagues and decades. Others are calibrated specifically to a single competition. The differences are usually small for typical shots but can diverge meaningfully for shots in unusual circumstances where the historical data is thin.

The practical implication is that xG values should be compared within the same provider’s data rather than across providers. A player’s seasonal xG total on one platform is meaningful in context. Comparing it to a different total from a different platform without knowing the model differences behind each is less useful.

Post-Shot xG and What It Adds

The basic xG model calculates the probability of a shot resulting in a goal before the shot is actually taken — based on position, context, and historical conversion rates from comparable situations. Post-shot xG, abbreviated as PSxG, extends the analysis by incorporating what actually happened during the shot itself.

Where basic xG tells you how likely a chance was to be scored based on circumstances before the shot, PSxG tells you how likely the specific shot that was produced was to result in a goal, accounting for placement within the goal frame and shot trajectory. A shot curled into the top corner from a tight angle might have a low basic xG because the position is difficult, but a high PSxG because the specific ball placed in that location was genuinely very hard to save. A shot hit directly at the goalkeeper from a clear central position might have a high basic xG but a low PSxG because the actual execution was poor.

PSxG is particularly useful for evaluating two positions. For goalkeepers, the gap between PSxG conceded and actual goals conceded measures how much they are saving shots that should statistically beat them. For strikers, consistent underperformance of basic xG — scoring fewer goals than the positions they reach would predict — can indicate finishing issues, but PSxG can reveal whether the problem is shot selection, execution, or simple statistical variance across a small sample.

For deeper analytical context on how statistical models function in sport and why even strong teams frequently produce results that diverge from what their quality suggests, 왜 강팀도 자주 패배하는가 provides directly relevant framing on probability and variance that underpins xG methodology. For a Seongnam-specific analytical case study applying these performance evaluation concepts to K League football, Understanding Football Player Ratings: A 2026 Seongnam FC Case Study demonstrates how these analytical frameworks apply in a local context.

xG does not predict the future. It does not tell you who will win the next match or whether a striker will score in the next game. What it does is provide a more honest account of the past — separating what happened from what the underlying quality of play suggested should have happened, and giving analysts, coaches, and engaged fans a more reliable foundation for evaluation than the scoreline alone can offer.

Understanding Football Player Ratings: A 2026 Seongnam FC Case Study

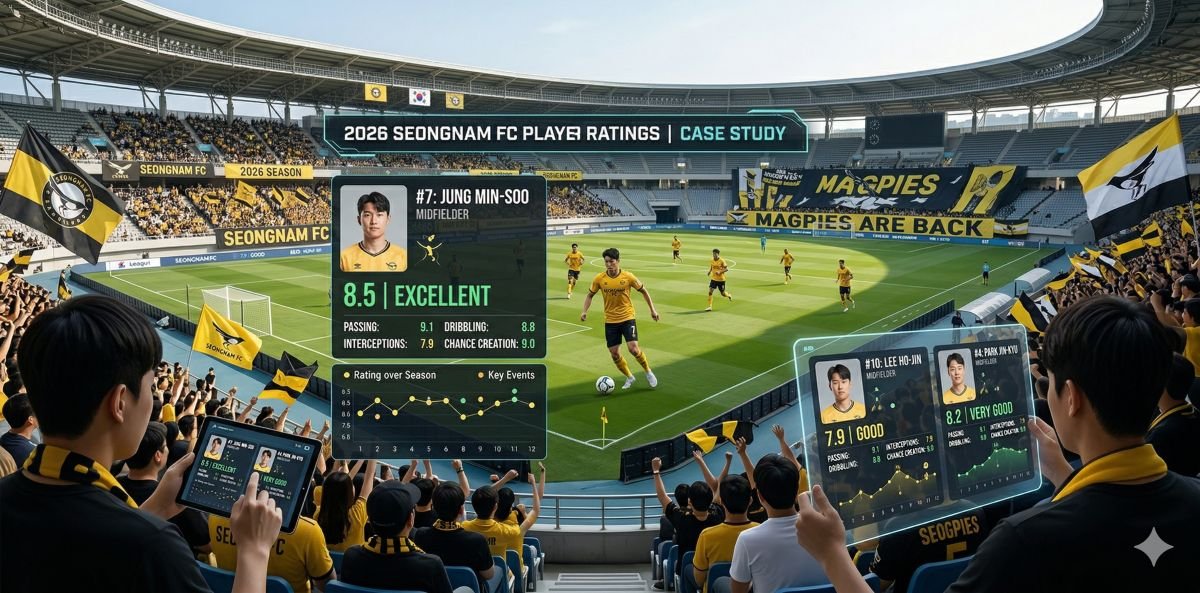
The opening rounds of the 2026 K League 2 season have provided a fascinating statistical puzzle for Seongnam FC supporters. After two matches, the club sits on two draws, having both scored and conceded three goals. While the league table suggests a stalemate, the algorithmic player ratings tell a more nuanced story of individual excellence. Brazilian midfielder Elionay currently leads the squad with a standout rating of 7.22, followed closely by Jue-An Yoo at 7.13 and Seung-Yong Jung at 7.08.

For the average fan checking their phone at Tancheon Sports Complex, these numbers are a shorthand for “who played well.” However, the methodology behind these decimals is rarely explained. By using Seongnam’s early 2026 data as a grounded case study, we can deconstruct how these ratings are built, what they prioritize, and where they might miss the mark.

The Foundation: Event-Based Data Collection

Modern player ratings are not the result of a human scout sitting in the stands with a clipboard. Instead, they are generated by algorithms that ingest thousands of data points per match. Every touch of the ball is categorized as an “event.” When Elionay makes a pass, the system doesn’t just record a successful completion; it notes the coordinates of the pass, the distance, the direction, and the pressure from the opponent.

These events are assigned a base value. A forward pass into the final third is worth more than a sideways pass in the defensive half. For a midfielder like Elionay, a high rating of 7.22 suggests he is not just retaining possession, but consistently performing “high-value” actions that progress the ball into dangerous areas. The algorithm rewards the technical difficulty and the strategic intent of his play, which explains why his rating remains high even when the team as a whole settles for a draw.

The Weight of Outcomes: Goals, Assists, and Errors

While the “volume” of actions provides the baseline, specific outcomes act as massive multipliers. Goals and assists are the most significant boosters in any rating system. If Jue-An Yoo scores a late equalizer, his rating might jump from a 6.5 to a 7.5 instantly. This is because algorithms are designed to mirror the impact of the match.

Conversely, “negative events” act as heavy anchors. A defensive error leading to a goal, a red card, or a missed “big chance” will cause a player’s rating to plummet. In Seongnam’s opening matches, conceding three goals likely suppressed the ratings of the defensive line, even if their individual positioning was generally sound. Algorithms struggle with “off-the-ball” contributions, such as a defender who prevents a pass by simply standing in the right lane. Because no “event” occurred, the system has nothing to reward.

Why Ratings Differ Across Platforms

Fans often notice that a player might be a 7.2 on one app and a 6.8 on another. This happens because different platforms use different weighting for their variables. Some systems, like those used by professional clubs for recruitment, might prioritize “Expected Goals” (xG) or “Expected Assists” (xA). Others might give more weight to defensive actions like interceptions and successful tackles.

For instance, Seung-Yong Jung’s 7.08 rating suggests a balanced contribution. On a platform that favors defensive stability, he might be the highest-rated player. On a platform that over-indexes on offensive creativity, he might slip behind the attackers. This discrepancy is why it is essential to view these numbers as a single perspective rather than an absolute truth. You can see how 축구 기대 득점(xG)과 기대 도움(xA)의 힘 provides the mathematical backbone for these different interpretations.

The Limits of the Algorithm

The greatest weakness of any player rating system is its inability to account for tactical instructions. If a Seongnam coach instructs a winger to stay wide and stretch the defense without touching the ball, that player is technically performing his job perfectly. However, the algorithm will see a player with very few touches and likely hand them a low 6.0 rating.

Furthermore, these systems often fail to capture the “emotional” or “leadership” value of a player. A captain who organizes the defense during a frantic final five minutes provides immense value that isn’t captured in a tackle count. This is why a 7.22 rating for Elionay is an indicator of high technical output, but it doesn’t tell us if he was the vocal leader on the pitch.

Understanding these limits helps fans avoid the trap of “stat-watching.” While numbers provide a clear framework, they are often a reaction to what happened, not a prediction of what will happen next. This is a common hurdle in sports analysis, where the limits of probability in single-event outcomes remind us that a high player rating doesn’t guarantee a win in the next match.

Conclusion: Context is King

Player ratings are a powerful tool for comparing performance across a long season, but they require context to be useful. Elionay’s 7.22 is a signal of elite technical consistency in the K League 2, but it must be viewed alongside the team’s three goals conceded.

As the 2026 season progresses, these ratings will fluctuate. A player who starts with a string of 8.0 performances might regress as opponents adapt to their style. For Seongnam FC followers, the key is to use these numbers as a starting point for conversation, not the final word on a player’s worth. The algorithm sees the touches, but the fans see the effort, the grit, and the local pride that a number can never fully quantify.

2026 K League 2 Promotion and Relegation: A Guide for Seongnam FC Fans

The 2026 K League 2 season marks a fundamental shift in the landscape of South Korean football. For years, the second division operated as a somewhat insulated environment where the primary focus was looking upward toward the top flight. That changed this year with the historic introduction of movement between K League 2 and the K3 League. This new layer of consequence means that every match involves a calculation of survival, not just ambition.

For a club like Seongnam FC, a pillar of football in Gyeonggi-do, the stakes have shifted from a simple desire for promotion to a multi-front battle. Understanding the mechanics of this system is the only way to make sense of the tension currently felt at Tancheon Sports Complex.

The Race for the Top: Automatic Promotion

The most straightforward path to K League 1 remains the most difficult to achieve. In 2026, the reward for consistency is higher than ever, as the top two teams in K League 2 earn automatic promotion. In previous cycles, only the champion was guaranteed a spot, forcing the runner-up into a volatile playoff against a K League 1 side.

By doubling the automatic promotion slots, the league has incentivized aggressive, win-oriented strategies. For Seongnam FC, finishing in these top two spots isn’t just about prestige, it is about financial security. Skipping the playoff rounds allows a club to begin its top-flight recruitment and budgeting weeks earlier than those stuck in the post-season tournament.

The Playoff Gauntlet: Third through Sixth

Below the top two, the league enters a high-stakes knockout phase. Teams finishing third, fourth, fifth, and sixth enter a promotion playoff structure. This is where the table position becomes a tactical weapon. The higher a team finishes within this bracket, the more advantages they receive, such as home-field preference and the “draw-advance” rule, where the higher-seeded team moves on if the match ends in a tie after regulation.

This structure creates a “league within a league.” A team in fourth place isn’t just playing to win, they are playing to catch the third-place team to secure a home match. For supporters, watching the point gap between sixth and seventh place is now just as important as watching the title race. One lapse in concentration in September can be the difference between a shot at the big leagues and another year in the second division.

The New Threat: K3 League Relegation

While the top of the table fights for glory, the bottom of the table is now a site of genuine peril. For the first time, the bottom-placed K League 2 club faces a direct threat from below. The team finishing last must defend its professional status in a single-match playoff against the K3 League champion.

This match is held at the home stadium of the K League 2 club, providing a slight geographic advantage, but the psychological pressure is immense. In this scenario, the K3 side plays with the house money of a potential historic upset, while the K League 2 side plays with the weight of a potential collapse. This addition ensures that matches between bottom-tier clubs in the final weeks of the season are no longer “dead rubbers” but desperate fights for professional relevance.

Why Position Matters More Than Ever

In this restructured environment, the league table is no longer just a list of who is winning, it is a map of risk and reward. Every rung on the ladder offers a different level of protection or opportunity. This is particularly true when analyzing how teams react to the pressure of the new system.

When a team like Seongnam FC finds itself in a mid-table scramble, the leadership must decide whether to pivot toward a defensive stance to avoid the bottom-tier playoff or to overextend for a top-six finish. These decisions are often influenced by how the club perceives its own stability and the fairness of the results they’ve seen so far. Interestingly, many supporters and even players often struggle with how a well-run team can still find itself in a relegation scrap. You can find a deeper look into why systems feel rigged early on to understand the psychological side of these table shifts.

The Seongnam FC Context

Seongnam’s position is unique because of its history and resources. As a club that has tasted continental glory, the pressure to occupy the top two spots is constant. However, the 2026 system punishes clubs that rely on reputation over current data. If the team falls into the third-to-sixth-place bracket, they enter a territory where variance and luck play a much larger role than they do in the 36-game regular season.

In short-tournament formats like the promotion playoffs, a single refereeing decision or a deflected shot can undo months of tactical discipline. This is why the push for automatic promotion is so frantic. The goal is to escape the “noise” of the playoffs entirely. For those interested in the math behind why these high-stakes matches often feel so unpredictable, it’s worth exploring the limits of probability in single event outcomes.

Conclusion

The 2026 K League 2 season has successfully removed the “boring” middle of the table. By adding a second automatic promotion spot and a relegation playoff at the bottom, the K League has ensured that almost every team has something to play for until the final whistle of the final day. For Seongnam FC, the mission is clear: stay out of the chaos of the playoffs and the danger of the basement. In this new era, the table isn’t just a record of the past, it’s a predictor of a club’s survival.

For further reading on the regional context of these changes, you can see how 법적 구조가 이용자 행동을 형성하는 방식 in the sports industry across different cities.

From Crowds to Calculations: How Odds Take Shape

The odds displayed on any market are not the output of a single calculation — they are the compressed result of a process that begins with human judgment, passes through quantitative modeling, and ends with the continuous pressure of collective participant behavior.

Most people encounter odds as finished products. A number is presented, a probability is implied, and a decision is made. The process by which that number arrived at its current value — the layered sequence of inputs, adjustments, and market forces that produced it — is almost entirely invisible from the participant’s side. That invisibility matters, because odds that appear authoritative are actually estimates in motion, shaped by forces that change from the moment a market opens to the moment it closes.

Understanding how odds take shape requires following that process from the beginning — from the initial assessment that opens a market, through the modeling that structures it, to the crowd behavior that continuously reshapes it in real time.

The Opening Line

Every market begins with a line — an initial set of odds established before any participant has placed a position. The opening line is the purest expression of the operator’s own probability assessment, before external behavior has had any opportunity to influence it.

Building that assessment draws on multiple inputs simultaneously. Historical data on the teams or competitors involved establishes a baseline. Recent form, injury reports, venue factors, head-to-head records, and any other information material to the outcome are incorporated into a probability model that translates qualitative and quantitative inputs into estimated likelihoods. Those likelihoods are then converted into odds and adjusted to include the operator’s margin — the structural overround that ensures the full market sums to more than one hundred percent.

The opening line is therefore not a neutral estimate of true probability. It is a modeled estimate with a built-in cost already embedded. The figure a participant first sees already reflects that cost, before the market has been influenced by anything external.

Where Human Judgment Meets Quantitative Modeling

The construction of an opening line is rarely a purely algorithmic exercise. Quantitative models provide the structural framework, but experienced traders apply judgment at the edges — adjusting for variables that are difficult to quantify, assessing how much weight to assign to recent information, and making calls about market sensitivity in areas where the model’s historical data is thin.

This human layer is most visible in markets where data is sparse: lower-division competitions, niche sports, early-season fixtures where recent form is limited. In these contexts, the opening line reflects a higher proportion of trader judgment relative to model output. As explored in Seoul Monthly’s structural analysis of how odds form and how market participants shape them, the interplay between algorithmic pricing and human adjustment is one of the less visible but most consequential features of how any odds market is constructed.

How Participant Behavior Reshapes the Market

Once a market opens, the odds begin to move in response to where positions are placed. This is the crowd layer of odds formation — the mechanism by which collective participant behavior continuously updates the probability surface.

The basic dynamic is straightforward. When a significant volume of activity concentrates on one outcome, the operator adjusts the odds on that outcome downward to reduce exposure, while adjusting other outcomes upward to rebalance the book. This movement is not a revised assessment of true probability. It is a risk management response to the distribution of positions held.

The implication is significant. Odds that move do not necessarily move because new information about the event has emerged. They may move because a large position was placed by a participant with no particular informational edge, or because a well-known sharp account triggered an automated adjustment, or because the distribution of activity across outcomes has drifted in a direction that creates one-sided exposure. Reading price movement as a reliable signal of revised probability requires knowing why the movement occurred — which is information participants almost never have access to.

The Sharp Money Effect

Not all participant behavior influences odds equally. Operators distinguish between position types based on the track record and profile of the accounts placing them. Activity from participants identified as consistently accurate — sharp money — triggers faster and larger adjustments than activity from the broader recreational participant base.

This tiered sensitivity means that the same nominal position size can produce very different market responses depending on its source. A sharp account placing a modest position on an outcome can move the odds measurably. The same amount from a recreational account may produce little or no movement.

Why This Creates a Layered Signal

The result is that odds movement contains a layered signal. Movement driven by sharp activity is more likely to reflect genuine informational content — a belief held by participants with a demonstrated edge. Movement driven by recreational volume is more likely to reflect sentiment, familiarity bias, or the influence of widely-circulated opinion rather than independent probability assessment.

For participants trying to interpret what moving odds actually mean, the distinction matters considerably. As detailed in Seongnam Insider’s analysis of how crowds and calculations combine to shape odds, the failure to distinguish between these two sources of price movement is one of the more consistent errors in how participants read market signals.

The Equilibrium the Market Seeks

The continuous interaction between the operator’s model, the sharp money layer, and the broader participant base pushes the market toward an equilibrium — a set of odds that balances the book while reflecting the aggregate information available to all participants. That equilibrium is never fully reached. New information arrives, new positions are placed, and the odds continue to adjust.

What emerges from this process is not a precise measure of true probability. It is a socially constructed estimate — the product of calculation, judgment, competitive positioning, and collective behavior operating simultaneously. The number on the screen is the surface of that process, not its conclusion.

Why HT/FT Bets Multiply Possible Outcomes

Most sports wagering markets reduce a match to a manageable set of outcomes. A standard 1X2 market — home win, draw, or away win — gives a participant three possibilities to evaluate. The analysis is relatively contained: assess the relative strength of the two sides, factor in home advantage and recent form, and arrive at a judgment about which of the three outcomes is most likely.

HT/FT betting — halftime/fulltime — operates on a fundamentally different structural logic. Understanding why HT/FT bets multiply possible outcomes is essential before engaging with this market, because the combinatorial expansion of outcomes is not just a feature of the format — it is the primary reason why both the potential returns and the difficulty of winning are substantially higher than in single-result markets.

The Combinatorial Structure

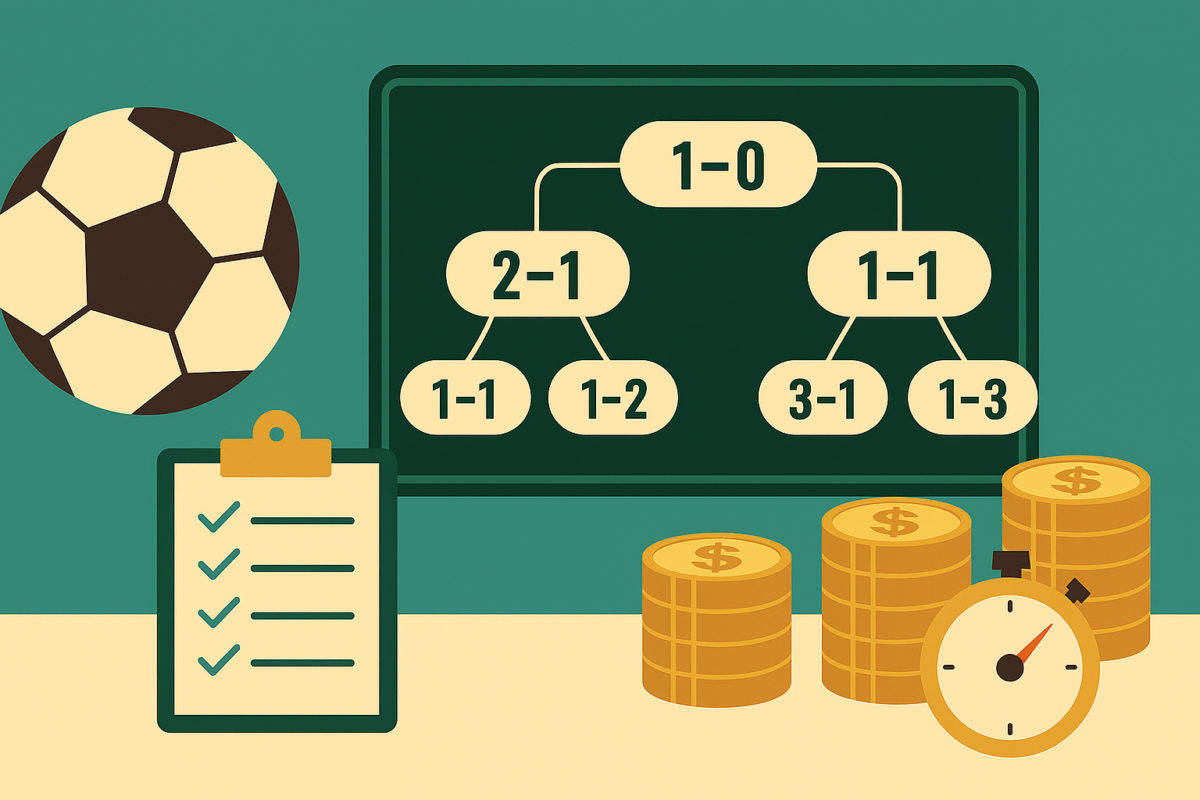
The mathematical structure of HT/FT betting is straightforward but important to grasp clearly. A standard football match has three possible results at any point: home win, draw, or away win. At halftime, there are three possible results. At fulltime, there are three possible results. When these two independent events are combined into a single prediction, the number of possible outcomes is not the sum of the two sets — it is their product.

Three halftime outcomes multiplied by three fulltime outcomes produces nine possible combinations. These are: home/home, home/draw, home/away, draw/home, draw/draw, draw/away, away/home, away/draw, and away/away. The first element in each pair represents the halftime result; the second represents the fulltime result.

This nine-outcome structure is what defines HT/FT betting. A participant is not choosing between three possibilities — they are choosing between nine. And because each of those nine combinations requires both components to be correct simultaneously, the probability of any given prediction being right is substantially lower than a standard match prediction, even when the individual components appear straightforward.

Why Some Combinations Are Structurally Rare

Not all nine outcomes are equally probable, and understanding the distribution matters for any serious analysis of this market. Some combinations are structurally common; others are structurally rare. The frequency of each reflects the underlying dynamics of how football matches unfold.

Home/home — the home team leads at halftime and wins at fulltime — is the most frequent combination in matches where the home side is the clear favorite, precisely because home teams that establish early leads tend to control the second half. Away/away follows a similar logic for matches dominated by the away side. Draw/draw occurs in closely matched contests where neither side creates a decisive advantage in either half.

The combinations that attract the highest odds are those that require a momentum reversal — a situation where the halftime result is overturned by fulltime. Away/home (away team leads at halftime, home team wins at fulltime), home/away, draw/away, and draw/home all require specific dynamics: an early lead surrendered, a second-half comeback, or a tactical shift that changes the course of the match. These outcomes happen, but they are the exception rather than the rule in most competitive contexts. Their rarity is precisely what generates their high odds — and precisely what makes them the most difficult to predict reliably.

The Odds Multiplication Effect

The relationship between the combinatorial structure and the odds is direct and mathematically precise. As explored in analyses of how HT/FT odds structure reflects the relationship between high odds and high risk, the odds attached to any HT/FT combination are not simply the odds of the fulltime result — they are a reflection of the joint probability of both the halftime and fulltime components occurring together.

When a strong home favorite has a fulltime win probability of roughly 60%, and a halftime lead probability of roughly 55%, the joint probability of both occurring — home/home — is approximately the product of these probabilities, adjusted for their correlation. The result is a combined probability that is lower than either component alone, which is reflected in odds that are higher than a simple home win but lower than the reversal combinations. The market pricing of HT/FT outcomes is, in this sense, an exercise in conditional probability: the odds of the fulltime outcome given the halftime outcome is established.

What This Means for Analysis

The nine-outcome structure of HT/FT betting has a specific implication for how analysis should be approached. A participant evaluating a standard 1X2 market needs to assess one question: what is the most likely overall result? A participant evaluating an HT/FT market needs to assess two questions simultaneously: what is the most likely halftime result, and given that result, what is the most likely fulltime outcome?

These are meaningfully different analytical tasks. The halftime result is influenced by factors that do not necessarily predict the fulltime result — the tactical approach of a team in the opening period, which may differ from their second-half setup; the pace at which a game begins; the specific personnel deployed in each half. A team that regularly starts conservatively and builds into matches may have a halftime profile that looks very different from its fulltime profile, even against the same opposition.

Understanding this divergence — between a team’s typical halftime and fulltime patterns — is the analytical edge that makes HT/FT analysis more than a dressed-up version of standard match prediction. The structure multiplies outcomes; the analysis has to match that complexity.

The Role of Bookmaker Margin

One dimension of HT/FT betting that receives less attention than it deserves is the bookmaker margin across nine outcomes rather than three. In a standard 1X2 market, the bookmaker’s margin is distributed across three possibilities. In an HT/FT market, that margin is distributed across nine. The result, in most cases, is that the HT/FT market carries a higher effective margin than the standard match market — meaning the built-in house advantage is larger relative to the odds offered.

This is not a reason to avoid the market, but it is a structural feature that informed participants account for. The attractive-looking odds on a reversal combination — the kind that would pay 15 or 20 times the stake — are not pure reflections of the combination’s rarity. They embed the bookmaker’s margin in addition to the underlying probability, which means the gap between the displayed odds and the fair odds is typically larger in HT/FT markets than in simpler markets.

Final Thoughts

HT/FT betting multiplies possible outcomes because it combines two independent predictions into a single simultaneous requirement. The resulting nine-combination structure is the source of both its appeal — higher odds, larger potential returns — and its difficulty. Neither dimension should be engaged with in isolation from the other. The higher odds exist because the correct prediction is genuinely harder to achieve, not because the market is systematically mispriced in the participant’s favor.

Engaging with the HT/FT market productively means understanding the full combinatorial structure, analyzing halftime and fulltime patterns separately and in relation to each other, and accounting for the margin embedded in the pricing. That is a more demanding analytical process than standard match prediction — which is exactly what the structure requires.

Nine outcomes means nine questions. Getting one right is not enough.

Why Early Success Feels Like Evidence

A beginner enters a new competitive system and wins. The feeling that follows is rarely interpreted as a probabilistic event — a natural outcome of variance distributing some positive results alongside negative ones at the start of any new engagement. Instead, it registers as something more significant: confirmation. The early win feels like the system recognizing something real about the person who just participated. It feels, in other words, like evidence.

Understanding why early success feels like evidence requires looking at the specific cognitive mechanisms that transform a statistically unremarkable early result into a subjectively compelling signal about personal capability — and why that transformation produces some of the most consequential errors in judgment that competitive environments generate.

The Pattern Recognition Problem

The foundational mechanism is one of the oldest in cognitive psychology: the human mind is built to find patterns. This is not a flaw — it is a deeply adaptive feature. In most environments across most of human evolutionary history, the ability to quickly identify patterns in sensory data was genuinely useful. A repeated noise pattern indicated a predator. A repeated growth pattern indicated a food source. Acting on early pattern signals — before the full data set was available — was often safer than waiting for statistical certainty.

In competitive systems governed by probability and variance, this same pattern-recognition instinct becomes a liability. A run of early wins does not, in most cases, represent a meaningful pattern. It represents variance — the natural clustering of outcomes that probability produces even in sequences that are entirely random. But the mind that evolved to detect real patterns does not automatically distinguish between patterns produced by underlying structure and clusters produced by chance. Both feel the same. Both trigger the same interpretive response: something is happening here that reflects a real underlying reality.

Research on the hot hand fallacy — first documented systematically by Gilovich, Vallone, and Tversky in 1985 — demonstrates this tendency with particular clarity. The study found that 95% of basketball fans surveyed believed that a player who had made several consecutive shots had a genuinely higher probability of making the next one, despite statistical analysis showing that each shot’s outcome was independent of previous ones. The subjective experience of a streak is identical whether the streak reflects genuine skill elevation or random clustering. The mind cannot tell the difference from the inside.

Self-Attribution and the Interpretation of Early Wins

Pattern recognition explains why early success feels meaningful. Self-attribution bias explains why it feels personal. As discussed in analyses of why early wins lead to misjudgment about short-term results, the tendency to attribute positive outcomes to internal factors — skill, judgment, superior insight — while attributing negative outcomes to external factors is one of the most consistently documented patterns in behavioral research.

For a beginner experiencing early wins, this bias operates without the corrective knowledge that experience provides. An experienced participant who wins can calibrate their interpretation: they know the variance of the system, they understand the role of luck in individual outcomes, and they have a baseline expectation of win rates that allows them to contextualize a run of positive results. A beginner has none of this calibration. The early wins arrive without context, and the most available interpretation — the one that self-attribution bias makes automatic — is that the wins reflect genuine personal capability.

This attribution feels not just comfortable but correct, because the beginner has no empirical basis for doubting it. They have won. Winning is a positive outcome. Positive outcomes feel like confirmation. The logical structure of the inference — “I won, therefore I am good at this” — seems compelling precisely because it follows the form of real evidence, even when the sample size is too small to support the conclusion.

The Overconfidence Cascade

The consequences of treating early success as evidence extend beyond the initial misattribution. Once early wins are interpreted as confirmation of genuine capability, a cascade of secondary effects follows that compounds the original error.

Confidence rises disproportionately to the evidence that actually supports it. Research on overconfidence consistently shows that confidence and accuracy diverge most sharply when individuals are making judgments in domains where they have limited experience — exactly the condition that early success in a new system creates. In one classic experiment, participants’ confidence in their judgments increased from 33% to 53% as they received more information about a problem, while their actual accuracy remained below 30%. More information — or in the context of competitive systems, more early wins — produced more confidence without producing more accuracy.

This divergence has a specific practical consequence: the beginner who interprets early wins as evidence of skill tends to increase their stakes, expand their activity, and reduce their caution — at precisely the point in their development when the opposite approach would serve them best. The early wins that felt like evidence were actually the most dangerous period of the learning curve, because they created confidence without the underlying competence that should accompany it.

Small Samples and the Illusion of Certainty

The statistical reality that early success obscures is straightforward: small sample sizes cannot support strong inferences. The outcome of three or five or even ten early interactions with a competitive system tells a participant very little about their underlying capability relative to that system. The natural variance of most competitive environments is large enough that a run of positive early results is consistent with a wide range of underlying skill levels — including no particular skill advantage at all.

This is the core of what makes early success so cognitively dangerous. It generates the subjective experience of certainty — the feeling of having learned something real about oneself and the system — from a data set that cannot actually support that certainty. The feeling of certainty is real. The evidence behind it is not.

Experienced participants in any competitive system know this. They have seen enough variance across enough outcomes to understand that early results are the least reliable information the system provides. The beginner, by definition, has not yet accumulated the experience that would allow them to calibrate their interpretation of early wins against the full distribution of what variance actually produces.

What Early Success Actually Tells You

Early success, interpreted carefully, provides one piece of genuinely useful information: the system is not so difficult or unfavorable that positive results are structurally impossible. That is a meaningful data point. It is not, however, confirmation of skill, confirmation of a winning system, or confirmation that the results will continue.

The most productive interpretation of early wins is precisely the one that feels least satisfying: these results are drawn from a small sample in a high-variance environment, and the appropriate response is curiosity and continued observation — not confidence and increased commitment. That interpretive discipline is difficult to maintain against the pull of self-attribution bias and pattern recognition. But it is the discipline that separates participants who learn from competitive systems from those who are misled by them.

Early success is a data point. Only time and sample size can tell you what it actually means.

Why Certainty Is Overestimated in Sports

Sports feel knowable. The teams are familiar. The statistics are available. The form guides, injury reports, and tactical analyses are published and accessible to anyone who wants them. The sheer volume of structured information that surrounds modern professional sport creates an environment in which confident predictions feel not just possible but well-founded — supported by evidence, grounded in data, informed by expertise.

This feeling of certainty is one of the most consequential cognitive errors that anyone engaging with sports outcomes can make. Understanding why certainty is overestimated in sports requires examining the specific mechanisms that make sport feel more predictable than it is — and why those mechanisms operate with particular force in a domain where information is abundant, emotional investment is high, and the desire for reliable prediction is strong.

The Illusion of Knowledge

The first mechanism is what behavioral economists call the illusion of knowledge: the tendency for more information to increase confidence without proportionally increasing accuracy. This effect is particularly well-documented in domains where information is abundant but outcomes are genuinely uncertain.

Research on overconfidence bias demonstrates the pattern clearly. In one study, groups of people with varying levels of domain expertise made predictions and reported their confidence levels. As participants were given more information, their confidence increased substantially — but their accuracy did not improve to match it. The additional information created the subjective experience of being better-informed without the objective improvement in predictive power that experience seemed to promise.

Sports is an ideal environment for this dynamic. A participant who has studied team statistics, analyzed recent form, reviewed head-to-head records, and read tactical analysis feels, reasonably, that they are better positioned to predict an outcome than someone who has not done any of this work. That feeling is partially accurate — informed analysis does provide some edge over pure guessing. But the subjective confidence that detailed information generates tends to outrun the objective edge it provides. The gap between felt certainty and actual predictive accuracy is persistent and large.

Why Sports Feel More Predictable Than They Are

Beyond the illusion of knowledge, sports have specific structural features that make outcomes feel more predictable than the underlying variance actually supports.

Narrative coherence is the most powerful of these. Sports outcomes are reported and discussed in narrative terms: a team was dominant, a player was inspired, a tactical adjustment was decisive. These narratives are retrospectively compelling — they make sense of outcomes after the fact in ways that feel like they should have been predictable before it. Hindsight bias, the well-documented tendency to perceive past events as more predictable than they actually were, is systematically reinforced by sports reporting. The story of why a result happened is constructed after the result is known, and it almost always sounds like it had to happen that way.

This retrospective intelligibility creates a false sense of prospective predictability. Because the explanation of what happened always sounds coherent after the fact, the explanation of what will happen sounds similarly coherent before it. The same narrative structures that make sports outcomes feel understandable in hindsight make predictions feel well-founded in foresight — even when the underlying uncertainty has not meaningfully changed.

Research on sports wagering supports this directly. Experimental evidence finds that participants consistently assign higher subjective winning probabilities to sports predictions than to neutral lotteries with mathematically identical odds. The familiarity and narrative structure of the sports domain generates a premium in perceived certainty that has no basis in actual predictive accuracy. As analyses of the relationship between probability, uncertainty, and what can genuinely be predicted in competitive systems document, the gap between what participants feel they can predict and what the variance structure of competitive outcomes actually allows is one of the most consistent findings in behavioral research on sports.

The Expert Problem

Expertise in sport — genuine, deep, hard-won expertise — does not solve this problem. In many cases, it makes it worse.

Research consistently shows that domain expertise increases overconfidence more than it increases accuracy. Experts know more real information about the domain, which increases the felt basis for confident prediction. But competitive sports outcomes are influenced by variables that no amount of domain knowledge can reliably capture: individual performance variance on a given day, the specific interactions of two complex tactical systems, injury effects that are not publicly known, and the inherent randomness of events like set pieces, individual moments of skill, and referee decisions. None of these are systematically captured by historical statistics or tactical analysis, regardless of how sophisticated that analysis is.

The implication is that the expert who predicts sports outcomes with high confidence is exhibiting the same overconfidence bias as the casual observer — just with a more elaborate supporting rationale. Overconfidence bias, as behavioral research consistently demonstrates, is the most prevalent cognitive error in prediction across virtually every domain, and it does not diminish with expertise. In some contexts, it increases.

What Genuine Uncertainty Looks Like in Practice

Understanding why certainty is overestimated in sports does not produce a simple corrective. The variance in competitive sports is real, it is large, and it does not resolve into predictability with more analysis. A team that wins 60% of its matches will still lose 40% of them. A heavily favored side will lose more often than participants who treat the favorite’s form as near-guarantee expect. Upsets are not aberrations — they are the statistical consequence of the variance inherent in competitive outcomes, occurring at roughly the rate that the underlying probabilities predict.

The most practically useful response to this reality is calibrating confidence to the actual variance of the domain rather than to the subjective feeling of knowledge that familiarity and narrative coherence create. In quantitative terms, this means treating probabilities as probabilities — acknowledging that a 70% probability outcome fails 30% of the time — rather than treating high probability as certainty. In qualitative terms, it means remaining genuinely uncertain about specific match outcomes even after thorough analysis, because thorough analysis does not eliminate the variance that makes outcomes uncertain.

Final Thoughts

Certainty is overestimated in sports because information abundance creates the illusion of knowledge, narrative coherence makes past outcomes feel inevitable, and expertise increases confidence faster than it increases accuracy. None of these mechanisms are moral failures. They are structural features of how human cognition engages with probabilistic domains that offer rich narrative framing and high emotional stakes.

Recognizing them is the beginning of engaging with sports outcomes more realistically — not to eliminate prediction, but to hold it with the appropriate degree of confidence that the underlying uncertainty actually warrants.

The feeling of certainty and the fact of certainty are two very different things. Sport is where that difference has the highest cost.

Why Simple Explanations Feel Safer Than Accurate Ones

There is a persistent and well-documented tendency in human cognition to prefer explanations that are easy to understand over explanations that are accurate. When confronted with a complex outcome — an unexpected result, a streak of losses, a market movement that defied expectations — the mind does not automatically search for the most correct explanation. It searches for the most comfortable one. And comfort, in cognitive terms, is almost always associated with simplicity.

Understanding why simple explanations feel safer than accurate ones requires examining a set of cognitive mechanisms that operate beneath the level of conscious deliberation — mechanisms that shape what feels true, what feels trustworthy, and what kind of explanation the mind accepts as sufficient before moving on.

Cognitive Ease and the Illusion of Truth

The foundational concept here is what psychologists call cognitive ease — the subjective feeling of effortlessness that accompanies processing information that is familiar, clear, and simply structured. Research originating from Kahneman and Tversky’s work on System 1 and System 2 thinking, and extended substantially by Norbert Schwarz and colleagues, demonstrates that cognitive ease produces a measurable positive affective response. Information that is easy to process feels good. And information that feels good tends to feel true.

This is not a minor or easily correctable bias. Studies on processing fluency have found that statements written in an easy-to-read font are judged as more likely to be true than identical statements written in a harder-to-read font — even when the font has no logical relationship to the statement’s content. Stocks with easy-to-pronounce names have been found to outperform stocks with difficult names in the short period following an IPO, apparently because ease of processing creates a familiarity signal that investors misinterpret as quality. Rhyming statements are judged as more accurate than equivalent non-rhyming statements. The mind is systematically confusing the ease of processing an explanation with the correctness of that explanation — and it does so automatically, before deliberate reasoning can intervene.

Why Accuracy Is Cognitively Expensive

The problem with accurate explanations of complex outcomes is that they are, by their nature, complex. Variance and probability are inherently difficult concepts. The accurate explanation for a run of losses in a competitive system is almost always probabilistic: the expected distribution of outcomes for a new participant in a skill-based environment includes a substantial portion of losses, especially early, because skill differentials are real and take time to overcome. That explanation requires the mind to hold multiple variables simultaneously — the baseline distribution of outcomes, the specific skill gap, the expected convergence toward better results over time — and to resist the simpler narrative that the losses mean something more immediate and personal.

This is exactly the kind of effortful, multi-variable analysis that probabilistic thinking demands and that the human pattern-recognition instinct resists. The mind evolved to find patterns quickly and act on them — not to maintain probabilistic uncertainty about whether a pattern is real. When faced with an ambiguous situation, the mind defaults toward the explanation that resolves the ambiguity most rapidly and completely. Simple explanations resolve ambiguity faster than accurate ones. They therefore feel better, feel safer, and tend to be adopted first.

The Narrative Pull

Beyond cognitive ease, simple explanations carry a structural advantage: they fit the format of a story. Human memory and comprehension are organized around narrative — sequences of cause and effect, agency and consequence, beginning and resolution. A simple explanation maps directly onto this format. “I lost because the system is unfair” is a complete narrative: agent, antagonist, outcome, cause. “I lost because the statistical distribution of outcomes for early-stage participants in this skill differential environment skews negatively before sufficient experience accumulates” is not a narrative. It is an analytical framework, and the mind does not store or recall it with the ease that it stores a story.

This narrative pull has practical consequences. People who adopt simple explanations for their losses tend to repeat their mistakes — because the simple explanation does not identify a correctable cause within their own approach. The system is unfair; therefore nothing about my approach needs to change. The accurate explanation, by contrast, identifies a specific and modifiable cause: insufficient experience and pattern recognition, which improves over time with deliberate practice. The accurate explanation is harder to hold, but it is more useful.

The Role of Emotional State

The preference for simple explanations intensifies under emotional stress. Research on processing fluency consistently shows that cognitive strain, emotional arousal, and time pressure all increase reliance on heuristic shortcuts — the fast, automatic System 1 processing that defaults to simple pattern recognition and familiar explanations. When losses arrive with emotional weight attached, as early losses in competitive systems consistently do, the conditions for maximum cognitive ease bias are all present simultaneously: the person is emotionally activated, cognitively strained, and seeking resolution of an uncomfortable situation as quickly as possible.

In that state, the simple explanation is not merely preferred — it is experienced as obviously correct. The feeling of recognition that accompanies a fluent, narrative-compatible explanation registers as insight rather than shortcut. The person does not feel like they have taken a cognitive shortcut. They feel like they have understood something.

What This Means for Decision-Making

Recognizing that simple explanations feel safer because of how the mind processes information — not because they are more likely to be correct — creates a specific and actionable form of skepticism. When an explanation arrives that feels immediately satisfying, that requires no effort to hold in mind, and that fits neatly into a familiar narrative structure, those qualities are precisely the features that warrant closer examination.

The question to ask is not whether the explanation feels right, but whether it is falsifiable, specific, and consistent with the full range of available evidence. Simple explanations tend to be unfalsifiable — “the system is rigged” cannot be disproved by any individual outcome. Accurate explanations tend to generate specific predictions: if the losses are the result of a skill gap, improvement should follow from deliberate practice and accumulated experience. If improvement does not follow, the accurate explanation needs updating. The simple explanation never needs updating, because it was never specific enough to be wrong.

Final Thoughts

Simple explanations feel safer than accurate ones because cognitive ease, narrative structure, and emotional state all push the mind toward the explanation that is easiest to process — not the one that most accurately describes reality. This preference is not a character flaw. It is a structural feature of human cognition, documented consistently across decades of behavioral research.

Understanding it does not eliminate the preference. It creates the conditions for catching it — and for choosing the harder, more accurate explanation when the stakes of getting it wrong actually matter.

The explanation that feels right is the one most worth questioning.