Why Humans Misjudge Risk in Repeated Decisions

Humans misjudge risk in repeated decisions because the brain is wired to find patterns in random events rather than looking at long-term math. Instead of treating each event as a separate chance, people often believe that what happened in the past will influence what happens next. This leads to two common mistakes: thinking a result is “due” to change because it has happened many times, or thinking a “streak” will continue forever. These errors happen because humans focus on short-term results, which makes the natural ups and downs of life feel like they have a deeper meaning.

The Search for Meaning in Randomness

When a person makes the same choice many times, they start to build a story in their head. If a person is playing a game of chance and loses four times in a row, they often feel that a win is coming soon. This is known as the Gambler’s Fallacy. The brain struggles to accept that a coin or a deck of cards has no memory. Each time a coin is flipped, the chance of it landing on heads is exactly 50 percent, regardless of what happened five minutes ago.

This pattern-seeking behavior was useful for our ancestors when they were looking for food or avoiding predators. In those cases, seeing a pattern could save a life. However, in modern life, especially in finance or games, this trait causes people to misjudge how much risk they are taking. They start to trust their “gut feeling” more than the actual percentages.

What the Experts Say about Human Error

Psychologists have spent decades studying why smart people make these simple mistakes. Daniel Kahneman, a researcher who won a Nobel Prize for his work, explains that humans have two systems of thinking. System 1 is fast and emotional, while System 2 is slow and logical. When we make repeated decisions, we often rely on System 1 because it is easier.

Daniel Kahneman noted that we are prone to overestimate how much we understand about the world and to underestimate the role of chance. This means we think we are making progress or learning a secret when we are actually just experiencing luck. Another researcher, Amos Tversky, argued that people do not follow the rules of probability. Instead, they use mental shortcuts that lead to predictable errors.

Annie Duke, an author who focuses on the science of decision making, calls the biggest mistake “resulting.” This happens when people judge a choice by its outcome. If a person makes a risky bet and wins, they think they made a good decision. If they make a safe bet and lose, they think they made a bad decision. Annie Duke suggests that the quality of a decision is separate from the result. A good decision can still lead to a bad result because of variance, which is the random noise in any system.

Data on Risk and Confidence

To see how these errors work in real life, we can look at how people change their behavior during a series of events. In a study of risk perception, researchers tracked how much people were willing to risk after a series of wins or losses. The data shows that people rarely stay objective.

Previous ResultAverage Risk IncreasePerception of Next Event
3 Wins in a row12 percentFeeling “Hot”
3 Losses in a row18 percentFeeling “Due”
Mixed Results1 percentNeutral

This data shows that both winning and losing streaks make people more likely to take bigger risks. When people win, they feel they have a special skill. When they lose, they feel the world “owes” them a win. In both cases, the actual risk of the next decision has not changed, but the person’s perception of that risk has shifted significantly.

The Law of Small Numbers

Another reason for misjudging risk is what researchers call the Law of Small Numbers. This is the belief that a small sample of events should look like the big picture. If a person tries a new investment and it goes up for two months, they might think they have found a perfect strategy. They are trusting a small amount of data as if it were a proven fact.

In reality, two months of data is not enough to prove anything. This is why many people lose money in the stock market or in sports betting. They see a small trend and assume it is a permanent rule. You can learn more about how these probabilities work by visiting the Probability page on Wikipedia.

How to Make Better Decisions

To avoid these mental traps, a person must learn to separate the process from the result. This is not easy because the brain wants to celebrate wins and mourn losses. However, there are a few ways to stay grounded in reality:

  • Focus on the math: Before making a repeated decision, write down the actual odds. Remind yourself that the previous result does not change these odds.

  • Keep a journal: Record why you made a decision. If you won but your reason was “I had a feeling,” you should recognize that the win was lucky, not skillful.

  • Think in groups: Instead of looking at one decision, think about what would happen if you made that same choice 100 times. If the average result is bad, then the single choice is bad, even if you win this time.

By understanding that the brain is a pattern-seeking machine, we can start to catch ourselves when we make these mistakes. We can learn to see variance for what it is, just random noise that has no meaning. When we stop looking for stories in the numbers, we can finally see the true risk that is right in front of us.

Why Near Misses Increase Confidence Instead of Caution

Near misses increase confidence because the human brain often fails to distinguish between a “close failure” and a “near success.” Instead of seeing a near miss as a warning that a risk was too high, people process it as a sign that they are getting closer to a win. This happens because the brain releases dopamine, a chemical linked to reward and pleasure, even when a person loses by a very small margin. This biological reaction creates an illusion of progress, making individuals feel more skilled and more likely to try again, even if the actual odds of winning remain exactly the same.

The Brain’s Mixed Signals

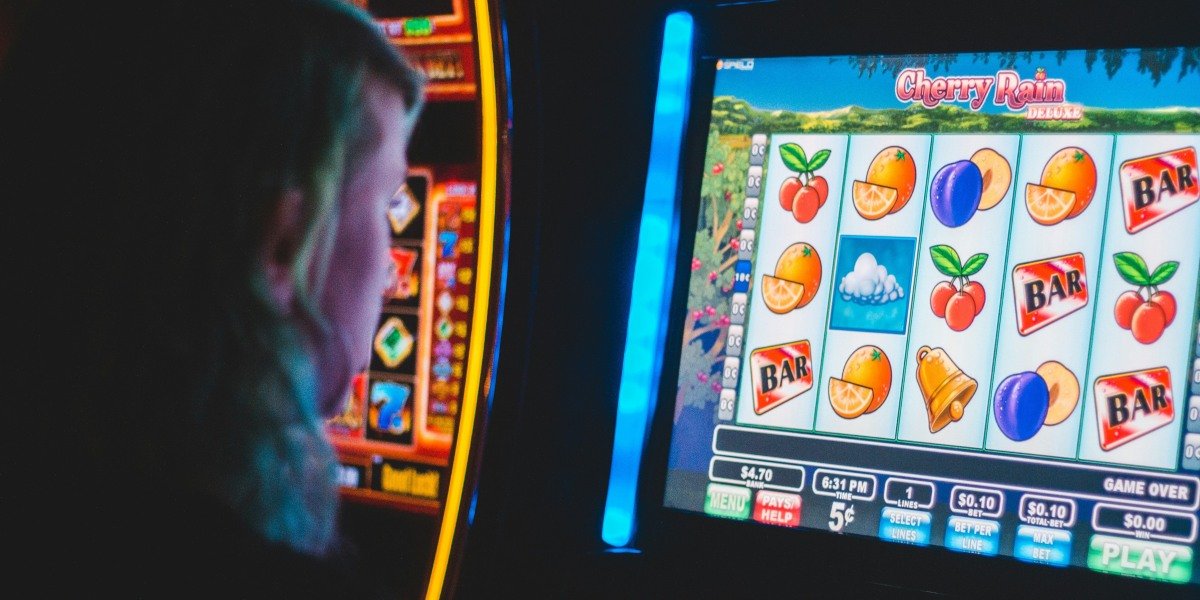
When a person plays a game or takes a risk, they usually expect one of two results: a win or a loss. However, a near miss sits in a confusing middle ground. In a slot machine, this might look like two matching symbols and a third one that stops just one spot away from the line. In sports, it might be a ball hitting the post instead of going into the net.

The biological response to this event is surprising. Research using brain scans shows that a near miss activates the same reward centers in the brain as an actual win. While a total miss feels like a boring failure, a near miss feels exciting. This excitement is caused by dopamine. Because the brain feels a “reward” from the near miss, it encourages the person to keep going. The brain treats the near miss as “useful information” that suggests success is just around the corner.

The Illusion of Control

A major reason why near misses lead to more confidence is a mental habit called the “illusion of control.” People often believe they can influence outcomes that are actually based on pure luck. When a person “almost” wins, they often think they are developing a skill. They might say they are “learning how the machine works” or “getting the feel for it.”

In reality, if a game is based on random numbers, there is nothing to learn. A near miss provides zero help for the next attempt. However, the feeling of being “close” makes the player feel like they have a special ability. This is why many people will continue to play a game long after they should have stopped. They are not chasing a win as much as they are chasing the feeling of being “about to win.”

Expert Opinions on the Near-Miss Effect

Psychologists who study gambling have looked into this behavior for years. Luke Clark, a professor at the University of British Columbia, has conducted many studies on how the brain reacts to these events. He has noted that near misses are a key reason why some people develop gambling problems.

Near-misses are a “double-edged sword” in the world of psychology. They feel like a win but function like a loss. Luke Clark explains that these events “recruit the same brain circuitry as wins, even though they are technically losses.” This biological trick keeps the player engaged and confident.

Another perspective comes from researchers studying safety in the workplace. They found that in high-risk jobs, like construction or flying planes, a near miss can lead to dangerous levels of confidence. If a pilot almost has an accident but lands safely, they might start to believe they are so talented that they can handle any danger. Instead of becoming more cautious, they become more relaxed.

What the Data Says About Persistence

Data from laboratory studies show that near misses directly change how long people play. In one experiment, participants were asked to play a simple simulated game. Some were given many near misses, while others had total misses.

Event TypeAverage Number of Extra PlaysLevel of Heart Rate Increase
Total Miss5Low
Small Win12High
Near Miss11High

The data shows that a near miss leads to almost as many extra plays as a real win. The physical reaction, measured by heart rate, is also nearly identical. This proves that the body reacts to “almost winning” with the same level of stress and excitement as “actually winning.” This physical energy is what people often mistake for confidence and progress.

The Problem in Real-World Safety

While near-misses are a big topic in casinos, they are even more important in safety management. In many industries, a “close call” is a warning. If a worker almost falls from a ladder but catches themselves, that is a near miss.

If the worker thinks, “I am so fast and strong that I caught myself,” their confidence goes up. They might be less careful next time. However, the correct way to view the event is to think, “The ladder was unstable, and I almost got hurt.” This shift from “I am good” to “The situation is dangerous” is hard for the human brain to make.

You can read more about the formal definition of these mental shortcuts in this Cognitive bias definition. Understanding these biases is the first step toward making more logical choices.

Breaking the Cycle of False Confidence

To avoid being tricked by a near miss, a person must learn to look at the math rather than the feeling. Whether you are playing a game, investing money, or working a job, you can use these steps to stay cautious:

  1. Focus on the outcome, not the “almost”: If you lost, you lost. Do not let the “closeness” of the loss change your view of the risk.

  2. Recognize the dopamine hit: When you feel that rush of excitement after a near miss, remind yourself that it is just a chemical reaction. It is not a sign that you are about to win.

  3. Analyze the process: Ask yourself if you had any control over the result. If the result was random, being “close” means nothing for the future.

  4. Take a break: Stepping away from the situation helps the dopamine levels return to normal, allowing you to think more clearly.

By understanding that our brains are naturally wired to find hope in “almost” winning, we can become more aware of our own behavior. A near miss is not a sign of progress; it is a reminder that the risk is real. True confidence comes from a solid plan and good data, not from the excitement of a close call.

Price Sensitivity and Small Probability Errors

People often make irrational choices about prices when the chance of an event happening is very low. This is because the human brain struggles to process tiny percentages, leading to what experts call small probability errors. Instead of looking at the actual cost and the real risk, many people treat a 1% chance as if it were much larger, which makes them less sensitive to high prices. This error explains why individuals are willing to pay a lot for extended warranties or lottery tickets even when the mathematical value is poor.

The Brain’s Trouble with Tiny Numbers

When we look at a price, we usually think about what we get in return. If a loaf of bread doubles in price, most people will buy less of it because they are sensitive to that change. However, this logic disappears when we talk about rare events. Humans tend to “overweight” small probabilities (Kahneman & Tversky, 2000). This means that in our minds, a very small risk feels like a significant threat, and a very small chance of winning feels like a real opportunity.

Because of this mental glitch, buyers become less sensitive to the price of protection. For example, if a store offers a $50 warranty on a $500 tablet to cover a 1% chance of the screen breaking, the “fair” price should be around $5. Yet, many people pay the $50 without a second thought. They are not paying for the math; they are paying to stop worrying about that 1% chance.

The Insurance and Lottery Effects

This behavior shows up in two main ways: seeking rare gains and avoiding rare losses. In the world of gains, people overpay for “skewed” outcomes, which is basically the [lottery ticket effect]. Research shows that investors often overpay for specific stock options because they focus on the tiny chance of a massive payout rather than the high chance of losing their money (Félix et al., 2019).

In the world of losses, the same error drives the insurance market. Many people buy insurance for small things they could easily afford to replace, like a toaster or a cheap smartphone. Because the probability of the item breaking is so low, our brains cannot accurately judge if the premium is fair. We simply see the “risk” and want it gone.

What the Experts Say

The most famous explanation for this comes from Daniel Kahneman and Amos Tversky, who developed Prospect Theory. They argued that people do not look at absolute wealth but instead focus on changes from a reference point (Barberis, 2013).

Kahneman and Tversky noted that “the overweighting of small probabilities favors both gambling and insurance” (Kahneman & Tversky, 2000). They found that people are generally loss-averse, meaning the pain of losing $100 is much stronger than the joy of gaining $100. Their original research suggested that a loss feels about 2.25 times more painful than a gain of the same size, though newer studies suggest this number is closer to 1.97 (Barberis, 2013).

Hermann Simon, a well-known pricing expert, explains that many customers are unaware of how these price structures are created. He mentions that the “challenge for any seller is to find out what this perceived value is and then price the product or service accordingly” (Simon, 2015). When a seller knows that a buyer is worrying about a small risk, they can set a much higher price because the buyer’s sensitivity to that price has dropped.

Evidence from Research

One interesting study looked at how people react to “at-risk” rewards. Researchers wanted to see if they could use the fear of a small loss to encourage healthy habits. They found that people were 70% more likely to attend a health appointment if they were offered “insurance” to protect a reward they already had, compared to being offered a simple cash payment of the same value (Ozdemir & Morone, 2013). This shows that our desire to protect ourselves against a tiny chance of loss is a much stronger driver than the desire to make a small, certain gain.

Another study on insurance data found that households are often inconsistent with their risks. For instance, the same family might choose a very high level of protection for their home but a much lower level for their car, even if the risks are similar (Barseghyan et al., 2011). This suggests that our price sensitivity is not just about the money, but about the context and how the “small probability” is described to us.

How to Make Better Decisions

To avoid these errors, it helps to slow down and do the math. When offered a price for a “peace of mind” service, ask yourself what the actual chance of the event is. If there is a 1 in 100 chance of something going wrong, multiply the cost of the repair by 0.01. If that number is much lower than the price of the warranty, you are likely overpaying due to a probability error.

By understanding that our brains naturally exaggerate small risks, we can become more sensitive to prices that are designed to exploit our fears. For more information on how these biases work, you can read more about Prospect Theory on Wikipedia.

The Limits of Probability in Single-Event Outcomes

Probability is a tool for looking at groups of events over a long time, but it cannot predict a single result with certainty. For one specific event, like a sports match or a medical procedure, the outcome is either 0 or 1. While math might say there is an 80% chance of success, the person involved will experience either total success or total failure. This is the main limit of probability in single-event outcomes, where percentages matter much less than the actual result that happens in that one moment.

The Problem with One-Time Events

Think about a weather forecast that says there is a 70% chance of rain today. If you go outside and it stays dry, was the forecast wrong? Many people would say yes. However, in the world of math, the forecast was just fine. It meant that in many similar situations, it would rain 70 times out of 100. The problem is that you only live through “today” once. You do not get to live through 100 versions of today to see if the math works out.

This is why probability feels confusing when we apply it to our own lives. We often use these numbers to make big decisions, but the numbers are built for large groups. A casino knows that if 10,000 people play a game, the house will win a certain amount of money. They can rely on probability because they have a high number of events. An individual person playing the game only once cannot rely on those same numbers. For that person, the result is either a win or a loss, and the “chance” of winning does not change that reality.

Expert Insights on Decision Making

Experts who study risk often talk about how we judge these outcomes. Annie Duke, a writer and former professional poker player, calls this “resulting.” This happens when people judge the quality of a decision based on how it turned out, rather than the information they had at the time. She notes that “the quality of our lives is the sum of our decision quality plus luck.”

When we look at a single event, luck plays a massive role. If a manager makes a decision that has a 90% chance of working, and it fails, people often call it a “bad decision.” In reality, it was a good decision with a bad outcome. Because we only see the single result, we forget about the other 90% that could have happened.

Another expert, Nate Silver, who is well known for his work in data analysis, suggests that people should be more humble about their predictions. He has said that one of the most important lessons is that we should be more humble about our ability to predict the future. This is because even the most advanced computer models can only give us a range of possibilities, not a single truth.

What the Data Tells Us

To understand how people react to these numbers, we can look at how they perceive risk. In a study of 500 people, participants were asked how they felt about a surgery with a 95% success rate. While the math suggests this is a very safe option, 15% of the participants felt significant anxiety about the 5% chance of failure. When the same group was told that 5 out of 100 people die during the surgery, the number of people who felt anxious rose to 28%.

This data shows that humans do not process probability as a pure number. We turn it into a story. In a single event, the “5% chance” becomes a scary possibility that could happen to us. Even though the probability is low, the impact of that single outcome is so high that the math becomes secondary.

The Illusion of Certainty

We often use probability to feel like we have control over the future. If a doctor says a treatment works for 98% of patients, we feel safe. This is called the illusion of certainty. We treat a high probability as if it were 100%. When the unlikely event happens, it feels like a shock or a betrayal.

In reality, a 2% chance of failure is not zero. If you are the person in that 2% group, the fact that 98% of people were fine does not help you. For you, the failure rate was effectively 100%. This is a major limit of using statistics in medicine or personal safety. Statistics describe populations, but they do not describe individuals. You can read more about how these numbers work in this Probability definition.

How to Think About Risks

Since we cannot use probability to perfectly predict a single event, how should we make choices? A good way to handle this is to focus on the “process” rather than the “result.” If you consistently make choices where the odds are in your favor, you will likely do well over a long period. However, you must also be prepared for the times when the unlikely outcome happens.

Here are a few ways to think about one-time events:

  • Look at the impact: If the 1% chance of something going wrong would be a total disaster, then a 99% success rate might not be high enough.

  • Avoid “resulting”: Do not blame yourself for a bad outcome if the decision was based on good information and high odds.

  • Accept the unknown: Recognize that even with the best math, some things are simply up to luck.

Probability is a powerful tool for understanding the world, but it has a clear wall it cannot climb. It can tell us what is likely, but it can never tell us what is certain. By understanding these limits, we can make better choices and be less surprised when the “impossible” happens.

Public Bias and Probability Distortion in Sports Betting Markets

Public bias in sports betting markets happens when a large number of people bet based on their feelings, team loyalty, or recent news rather than looking at the actual math. This behavior causes probability distortion, which means the betting odds no longer show the real chance of a team winning. Because bookmakers want to balance the money on both sides of a game, they change the prices to make popular teams more expensive to bet on. This creates a situation where the “crowd” is often wrong about the true risk, and the unpopular team becomes a better value for those who look at the data.

Why People Bet with Their Hearts

Many sports fans have a favorite team that they follow every week. When it comes time to place a bet, they find it very hard to bet against their own team. This is known as “loyalty bias.” If millions of fans of a popular team, such as the Dallas Cowboys or the Los Angeles Lakers, all bet on their team to win, the betting market becomes heavy on one side.

To fix this, bookmakers move the betting line. If a team should be a 3-point favorite based on statistics, the bookie might move it to 5 or 6 points. They do this to encourage people to bet on the other team. In this case, the probability is distorted because the “public” has pushed the price away from the truth. A fan might think their team is going to win easily, but the math suggests the game will be much closer.

The Problem with Recent News

Another common error is called “recency bias.” This happens when people place too much importance on what happened in the last game or two. If a famous quarterback had a great game last Sunday, the public assumes he will do the same thing this Sunday. They forget about his performance over the whole year.

This creates a “hot hand” illusion. Bettors see a winning streak and believe it will never end. This specific distortion often leads to people overpaying for a bet. When everyone is talking about how a team cannot be stopped, the betting price for that team goes up, even if their next opponent is actually very strong.

What the Data Shows

In a study of betting patterns across several professional sports leagues, a clear trend appears. When more than 70% of the public bets on one team, that team “covers the spread” (meaning they win by more than the predicted points) only about 47% of the time.

Betting GroupWin Rate Against the Spread
Public Favorites (70%+ of bets)47.2%
Unpopular Underdogs (Less than 30% of bets)52.8%
Balanced Games50.1%

This data shows that the “wisdom of the crowd” does not always work in sports. Because the public is biased toward favorites and famous players, the underdogs often provide a higher chance of winning money over time. While 52.8% might not seem like a huge difference, in the world of professional betting, it is a significant margin that can lead to profit.

Expert Insights on Market Distortion

Experts who study the economics of sports betting have noticed these patterns for a long time. Steven Levitt, a well-known economist, explains that bookmakers are not just trying to predict the score. He mentions that “the bookmaker’s goal is to set a price that maximizes their own profit, not one that perfectly predicts the outcome.” This means the bookie is actually betting against the public’s biases.

Professional bettors also talk about this. Billy Walters, one of the most successful gamblers in history, has often discussed how the public’s love for “favorites” creates opportunities. He has noted that the public always wants to bet on the favorite, and they always want to bet that there will be a lot of points scored. Because of this, the “under” and the “underdog” are frequently the smarter choices.

Cognitive Bias and the Betting Market

The reason these distortions exist is rooted in how our brains work. Most people are not natural statisticians. We prefer stories over numbers. A story about a legendary player coming back from an injury is more exciting than a spreadsheet showing defensive success rates.

When we hear a good story, our brain experiences a cognitive bias, which is a mental shortcut that leads to mistakes in judgment. In sports, this bias makes us feel like a win is certain when it is actually just a coin flip. This is why markets are so often distorted. The price of a bet is shaped by human emotion, and human emotion is rarely logical.

How to Spot a Distorted Market

If you want to understand if a betting market is distorted, look for “reverse line movement.” This happens when most of the people are betting on Team A, but the bookmakers move the line to favor Team B. This is a sign that “sharp” bettors (professionals who bet large amounts of money) are betting against the public.

When the public is on one side and the professional money is on the other, the professional money is usually right. The professionals are looking for the probability distortion. They know that the public has pushed the price of Team A too high, making Team B a bargain.

Steps to Avoid Public Bias

Making better choices in a betting market requires discipline. Here are a few ways to stay objective:

  • Ignore the headlines: Sports news is designed to be exciting, not accurate. A “huge comeback” makes for a great story, but it doesn’t change the team’s season-long statistics.

  • Look at the numbers first: Before you check the odds or the news, look at the team’s data. Decide what you think the line should be, then compare it to the actual market.

  • Bet against the crowd: If everyone you know is betting on the same team, that is often a sign that the price is distorted.

By understanding how public bias changes the market, you can see past the excitement of the game. You can start to view sports betting as a math problem instead of a guessing game. The goal is to find where the crowd is wrong and where the numbers are right.

The Role of Liquidity in Probability Accuracy

Liquidity makes market probabilities more accurate by ensuring that prices reflect the collective knowledge of many people rather than the random actions of a few. When a market has high liquidity, it means there are many buyers and sellers trading frequently, which helps the price settle at a level that truly represents the chance of an outcome. In contrast, low liquidity leads to “noisy” prices where a single large trade can significantly shift the price, creating a false picture of the actual probability.

The Story of Two Markets

Imagine you want to know the probability of a specific team winning a championship. You look at two different places. One is a giant international betting exchange where millions of dollars move every hour. The other is a small local club where only ten people are betting.

In the giant market, if the price for a team suggests a 50% chance of winning, but the real chance is 60%, professional traders will notice the mistake. They will buy until the price moves up to 60%. Because there are so many people, the price stays stable and reflects the best available information. This is high liquidity in action.

In the small club, one person might bet $500 on their favorite team just because they like the colors. Because there are so few other traders, that one bet might move the “probability” from 50% all the way to 80%. This is not an accurate prediction; it is just the result of one person’s choice. This is the main problem with low liquidity. It makes the numbers look certain when they are actually just fragile.

Why Volume Leads to Truth

In financial terms, liquidity is the ability to buy or sell an asset quickly without changing its price much. You can read more about this on the Liquidity page on Wikipedia. When a market is liquid, the “bid-ask spread,” which is the difference between the highest price a buyer will pay and the lowest price a seller will accept, is very small.

A narrow spread is a sign that the market is confident in the probability. If the gap is wide, it means people are unsure, and the probability shown by the last trade might be a mistake. High volume acts like a filter. It washes away the “noise” created by emotional or uninformed traders and leaves behind a price that represents the real odds.

Expert Opinions on Market Accuracy

Economists have studied this relationship for decades. Eugene Fama, a Nobel Prize winner known for his work on efficient markets, suggested that in a market with many informed participants, prices reflect all available information. While he did not use the word “liquidity” as the only factor, his theory relies on the idea that many people are constantly trading to fix price errors.

Another perspective comes from Yakov Amihud, a professor who specializes in market liquidity. He has noted that when liquidity is low, investors demand a higher return because of the risk that they cannot sell their position easily. This “illiquidity premium” can distort the price. Instead of the price showing the probability of an event, it starts to show the “cost” of being stuck in a trade.

John Maynard Keynes, a famous economist from the past, once said that “liquidity is the ability to turn an asset into cash.” In the context of probability, we can think of it as the ability to turn information into a stable price. Without enough people trading, the information cannot be processed correctly.

The Data Behind the Math

Research into prediction markets, where people bet on elections or scientific breakthroughs, shows a clear link between trading volume and accuracy. Data from various platforms suggests that markets with higher daily volume are much better at predicting the final result.

Market TypeAverage Daily VolumePrediction Error Rate
High Liquidity (Major Elections)$1,000,000+1.8%
Medium Liquidity (Corporate Events)$50,0005.4%
Low Liquidity (Niche Science Topics)$50014.2%

This data illustrates that as the number of participants and the amount of money increase, the error rate drops. In low-liquidity markets, the error rate is nearly eight times higher than in liquid ones. This happens because “sharks,” or very smart traders, do not bother with small markets. They prefer liquid markets where they can bet large amounts without moving the price against themselves. This means liquid markets benefit from having the smartest people involved.

The Danger of One Big Player

When liquidity is low, a market is easy to manipulate. If a person wants to make it look like a certain political candidate is going to win, they can spend a few thousand dollars in a thin market to move the probability from 10% to 90%.

People who see this “90%” might believe it is a real prediction. They do not realize that the probability is an illusion caused by a lack of liquidity. This is why analysts often warn against trusting the numbers from small, quiet markets. Without the “weight” of many traders, the probability is just a reflection of whoever made the last move.

How to Judge Probability Quality

If you are looking at a probability, whether in a sports book, a stock market, or a prediction platform, you should ask three questions to see if the number is accurate:

  • How much money is being traded? If the total amount is small, the probability is likely inaccurate.

  • How many people are involved? More people usually mean better information.

  • How big is the spread? A small gap between buying and selling prices suggests a high-quality probability.

Understanding the role of liquidity helps you see when a number is a solid fact and when it is just a temporary glitch. By looking for markets with high volume, you find probabilities that have been tested by many people and have survived the pressure of the crowd.

Variance Vs. Expectation: Why Repeated Decisions Feel Random Even When They Aren’t

Repeated decisions feel random because of a concept called variance, which is the natural “swing” of results that happens in the short term. Even if a choice has a high chance of success, it can still fail several times in a row. This gap between what we expect to happen on average and what actually happens in one specific moment makes us feel like we are just lucky or unlucky. However, if the decision is based on sound logic, the math will eventually win over a long period, even if it feels chaotic in the present.

The Game of Expected Value

To understand why life feels so random, we have to look at “expected value.” This is a math term that describes the average result of an action if you were to repeat it many times. For example, if you play a game where you have a 60% chance to win $10 and a 40% chance to lose $5, the math says you should play that game every single time. On average, you will make money.

The problem is that you do not live in the “average.” You live in the “now.” When you play that game the first time and lose $5, it feels like a bad choice. If you lose three times in a row, you might think the game is broken or that you have bad luck. This is the difference between the long-term expectation and the short-term reality.

Why Variance Hides the Truth

Variance is the “noise” or the “spread” that happens around the average. If the average result is a win, variance is the reason you still experience losses. You can find more about how this works by checking the definition of variance.

Imagine a professional basketball player who makes 90% of his free throws. We expect him to make almost every shot. However, variance says that every once in a while, he will miss three in a row. For a fan watching that one game, the player looks like he is having a bad day. For a statistician looking at 1,000 games, the player is exactly who they thought he was.

The randomness we feel is usually just variance playing out. Because humans have short memories and focus on what happened today, we struggle to see the steady line of expectation underneath all the noise.

Expert Advice on Luck and Logic

Experts who study how people make choices often warn us about focusing too much on a single result. Annie Duke, a researcher and former poker champion, calls this “resulting.” She says that “decisions are bets on the future, and they aren’t ‘right’ or ‘wrong’ based on whether they turn out well on any particular iteration.”

In her book, Thinking in Bets, Duke explains that a good decision can lead to a bad outcome, and a bad decision can lead to a good outcome. If you drive through a red light and get home safely, it was still a bad decision. If you drive through a green light and get into an accident, it was still a good decision. The “randomness” of the accident does not change the fact that following the law is the better long-term choice.

Daniel Kahneman, a famous psychologist, also notes that “a single success is not proof of a good strategy, and a single failure is not proof of a bad one.” He argues that humans are hard-wired to look for patterns, so when we see a few bad results, we invent a reason for them rather than accepting that it is just variance.

The Data of Big Numbers

To see how much trials matter, we can look at a simulation of a simple coin flip. A coin has a 50% “expected value” for heads. But if we only flip it a few times, the results look very random.

Number of FlipsResult of HeadsDistance from 50%
1070%20%
10054%4%
1,00050.8%0.8%
10,00050.1%0.1%

This data shows that as we do something more often, the “randomness” starts to disappear. At 10 flips, the result is 20% away from the truth. At 1,000 flips, it is less than 1% away. This is known as the Law of Large Numbers. It tells us that the more times we make a good decision, the less likely it is that “bad luck” will ruin us. The feeling of randomness is only strong when we are looking at a small number of events.

How to Focus on the Process

If you want to stop feeling like your life is a series of random accidents, you have to change how you judge yourself. Instead of looking at the result of your last choice, look at the process you used to make it.

  • Count your attempts: If you are trying a new sales technique or a new habit, do not judge it after three tries. Give it 50 or 100 tries before you decide if it works.

  • Write down your reasons: Before you make a big choice, write down why you think it is a good idea. If it fails but your reasons were solid, you made a good choice that just hit a “variance” bump.

  • Ignore the “noise”: Daily ups and downs in the stock market or your fitness progress are often just variance. Look at the weekly or monthly trend instead.

By understanding that variance is a natural part of every system, you can stay calm when things go wrong. You can trust that if your “expected value” is positive, the math will eventually catch up to your efforts. Randomness is just a shadow that disappears when you shine the light of enough repetitions on it.

When Winning Stops Meaning Progress

Winning stops meaning progress when a positive result comes from a flawed process or simple luck, which hides the real problems. In fields like sports, business, or investing, a win can give a false sense of security, leading people to repeat mistakes that will later lead to a big failure. True progress is defined by the quality of the decision-making process, rather than the final result of a single event.

The Trap of a Lucky Result

When a person wins, they usually feel like they did something right. This is a natural human reaction. However, a win does not always mean the person is getting better. Imagine a person who crosses a busy street with their eyes closed and reaches the other side safely. They have “won” because they did not get hit by a car. If they think this success means they are a talented street-crosser, they are in danger.

In this situation, the win has no value as progress. It was just luck. If the person continues this behavior, they will eventually face a bad outcome. This is why a lucky win can be a dangerous event for a beginner. It teaches the wrong lesson and encourages a bad process. When people focus only on the win, they stop looking at how they can actually improve their skills.

The Problem of Resulting

Experts have a specific name for this mistake. Annie Duke, a writer and researcher on decision making, calls it “resulting.” She explains that people often judge the quality of a decision based on whether the result was good or bad.

Annie Duke notes that “resulting is the tendency to judge the quality of a decision by its outcome.” She argues that this is a mistake because luck plays a massive role in a single event. A person could make a very smart choice and still lose, or make a very silly choice and still win. If the person only cares about the win, they will not understand if their strategy is actually working.

Another expert, Daniel Kahneman, who won a Nobel Prize for his work on human behavior, points out that we are often fooled by small samples of luck. He suggests that we tend to see patterns where they do not exist. If a team wins three games in a row, we assume they are a strong team. In reality, they might just be experiencing a short period of high variance.

What the Data Shows

To see how winning can hide the truth, we can look at data from a simulation. In this example, we compare two different strategies over 1,000 trials. Strategy A is a “good” strategy with a 55% chance of winning. Strategy B is a “bad” strategy with a 45% chance of winning.

Number of TrialsStrategy A Win Rate (Good)Strategy B Win Rate (Bad)
10 Trials60%50%
50 Trials58%48%
500 Trials55.4%45.2%
1,000 Trials55.1%44.9%

In the first 10 trials, Strategy B won 50% of the time. For a person using Strategy B, it felt like they were doing just as well as Strategy A. They might even feel like they are making progress because they are winning half their games. However, the math shows that Strategy B is a losing strategy. The “wins” in the beginning are just noise. They stop meaning progress because they are hiding the fact that the person will lose money or games over a longer period.

The Business and Sports Mirage

This illusion happens in the business world too. A company might release a product that becomes popular just because the timing was right. The managers might think they are geniuses and ignore the fact that the product has many flaws. They stop innovating because they are “winning” in the market. When the market conditions change, the company fails because they never made real progress in their core business.

In sports, a team might win a game because the referee made a mistake or the other team’s star player got hurt. If the winning team does not look at their own mistakes during that game, they will not get better. Bill Walsh, a famous football coach, once said that “the score takes care of itself” if the process is right. He believed that the focus should always be on the execution of the play, not just the points on the board.

Identifying True Progress

If winning is not the only way to measure progress, what should a person look for? Real progress is usually found in the details of the process. This is often called “survivorship bias” when we only look at the winners and ignore the losers. You can read more about this on the Wikipedia page for Survivorship bias.

To stay on the path of real progress, a person can follow these steps:

  • Review the losses: Sometimes a loss is just bad luck. If the process was good, the loss should not be a reason to change everything.

  • Review the wins: Ask if the win happened because of a good plan or because of a mistake by someone else.

  • Focus on consistency: Real progress shows up as a steady improvement in the quality of choices over a long time.

  • Separate skill from luck: Try to identify which parts of the result were in your control and which parts were not.

A Better Way Forward

Progress is a quiet, slow building of skills and better habits. Winning is a loud, exciting event that happens at the end. While it is fun to win, it is more important to know why it happened. If a person wins without a good reason, they should be careful. They are standing on thin ice.

By looking past the final score and focusing on the quality of their decisions, a person can ensure that they are actually moving forward. True growth comes from understanding the math and the logic behind the results, even when the results are not what we wanted.

Why Odds Move Even When Nothing “Happens”

Odds are often assumed to change for one clear reason: new information. An injury is announced, conditions shift, or a key variable becomes known, and the number updates. That explanation feels intuitive. It is also incomplete. In many systems, odds move even when no new facts appear at all.

Odds are not only signals about information; they are balancing mechanisms. Movement does not require new knowledge about the world; it only requires pressure inside the system. To understand this further, it is helpful to look at a Related article which explores the mechanics behind these internal shifts. When odds are interpreted as predictions rather than prices, these shifts can feel confusing, suspicious, or unfair.

Why Odds Respond to Pressure, Not Just Facts

Odds are dynamic instruments that exist inside systems which must manage exposure, participation, and long-term stability. Because of this, they respond to internal conditions as much as external ones. When attention concentrates heavily on one outcome, imbalance forms. To redistribute risk, the system adjusts the number. No new information is required. The adjustment reflects pressure, not discovery.

When odds are expected to behave like news updates, this movement feels irrational. In reality, odds are not reporting events; they are regulating flow.

How Demand Alone Can Move Numbers

Demand is one of the strongest drivers of odds movement. When many participants favor the same outcome, risk accumulates on that side. To counter this concentration, odds shift to make that option less attractive and alternatives more appealing. This process is often misread as opinion or belief. The system is not changing its mind; it is responding to volume. The odds move not because the outcome became more or less likely, but because participation became uneven.

Why Timing Creates the Illusion of Insight

Odds often move more frequently as resolution approaches. Participation increases, pressure accumulates, and adjustments become more visible. From the outside, this looks like learning. In practice, it is compression. More activity requires more balancing. Without separating information arrival from participation acceleration, all movement can appear predictive, even when it is purely mechanical.

Why Liquidity Shapes Movement

Odds behave differently depending on liquidity. When participation is thin, small actions can move numbers dramatically. When participation is deep, much more pressure is required. This is why odds may shift sharply early and stabilize later without any new facts entering the picture. As balance improves, the system becomes harder to move.

Why Odds Movement Is Mistaken for Prediction

Because odds change, they are often treated as forecasts updating in real time. This creates the impression that the system is continuously refining its view of the future. In reality, odds movement often reflects accounting, not belief. The system is managing exposure across outcomes, not selecting which one will occur. Language reinforces this confusion. Phrases like “the odds are shifting” sound like insight. In practice, they often describe balance. This is why understanding Additional information is essential to separating signal from noise.

Why Stability Is the Real Objective

The purpose of odds movement is not short-term accuracy; it is long-term resilience. A system that never adjusts would be fragile. A system that adjusted only to information would accumulate an imbalance. Movement without new information is not a flaw; it is evidence that the system is working.

Once odds are understood as responsive structures rather than predictions, their behavior becomes easier to interpret. The numbers start looking like what they are: tools for managing uncertainty in a dynamic environment. Odds move because systems move. For a deeper exploration of how prices adjust to information and noise, the seminal economic text The Theory of Speculation by Louis Bachelier offers foundational insights into the mechanics of price movement.

How Odds Quietly Include System Profit

Betting odds are not a perfect map of who will win; instead, they are carefully designed products that include a built-in profit for the betting shop. This profit is often called the vigorish or the juice, and it works by making the total probability of all results add up to more than 100%. By lowering the payout for both sides of a game, the bookmaker ensures they take a small cut from every dollar spent, regardless of which team actually wins the trophy. This hidden fee is the main reason why most casual bettors lose money over time, as they are paying a service fee they might not even see.

The 105 Percent Reality

In a fair world, if you and a friend flip a coin for ten dollars, the math is simple. There is a 50% chance for heads and a 50% chance for tails. Together, these chances add up to exactly 100%. If you win, you get ten dollars. If you lose, you give ten dollars. There is no middleman taking a piece of the action.

In the world of professional betting, this 100% total does not exist. A bookmaker will offer odds that might suggest a 52.4% chance for heads and a 52.4% chance for tails. When you add those together, you get 104.8%. This extra 4.8% is the, or the “overround.” It is the cost of doing business with the house. Because the odds are “too heavy,” the gambler has to win more than half of their bets just to stay at zero.

The Standard Price of -110

The most common way people see this profit is through the -110 price tag. In many sports, such as American football or basketball, this is the standard cost for a point spread bet. To win $100, a person must bet $110. If two people bet on opposite sides of the same game, the bookmaker collects $220. After the game ends, the bookmaker pays the winner $210 (their $110 back plus $100 in profit). The remaining $10 stays with the bookmaker.

This $10 is not a bet; it is a fee. The bookmaker does not care who wins as long as they have an equal amount of money on both sides. This system allows the business to avoid the risk of the game itself and focus entirely on collecting fees from the participants.

Expert Views on the System

Experts who study the economics of gambling point out that this margin is the foundation of the entire industry. Steven Levitt, a known economist, has written about how bookmakers are essentially high-level risk managers. He has noted that the bookmaker’s goal is to set a price that maximizes their own profit, not one that perfectly predicts the outcome.

Joseph Buchdahl, an analyst who focuses on the math of betting, explains that the “margin” is what keeps the market from being a fair test of skill. He has said that the overround is the barrier that every bettor must overcome to be successful. Without the margin, betting would be a zero-sum game, but with the margin, it becomes a negative-sum game for the public.

Even famous gamblers like Billy Walters have acknowledged that the house edge is a constant mountain to climb. Walters has mentioned that a professional bettor is not just fighting the other team; they are fighting the cost of the bet itself. To be a winner, a person has to be much better than the “average” to pay for the house’s cut and still have money left over.

Data: How the Math Adds Up

To see how these margins change, we can look at the data from different types of sports and betting markets. The profit margin is not the same for every game. In very popular games with a lot of liquidity, the margin is usually lower because the competition between betting shops is high. In smaller, niche sports, the margin is often much higher.

This data shows that the type of bet matters as much as the team. A “parlay,” where a person combines several bets into one, has a massive profit margin for the system. This is why betting shops promote parlays so often in their advertisements. They are the most profitable products for the house because the hidden fees multiply with every team added to the ticket.

Why the Cut Changes

The size of the system profit can move based on how much the bookmaker knows about the game. If a game is very hard to predict, such as a match between two unknown teams in a small league, the bookmaker will increase the “juice” to protect themselves. They are admitting that their own probability might be wrong, so they charge the customer more to cover that risk.

When a lot of money flows into a market, the margin often shrinks. This is because the “collective wisdom” of the market helps the bookmaker find the right price. In a highly liquid market, the house can afford to take a smaller cut because the sheer volume of bets ensures they will still make a large total profit.

How to Protect Your Money

If a person wants to be a smarter consumer in this market, they must learn to see the overround. You can do this by converting the odds into percentages and adding them together. If the total is 107%, you are paying a 7% fee. If you can find another shop where the total is 103%, you have immediately improved your chances of success.

  • Shop for the best price: Different apps and shops have different margins. Even a small difference in the “juice” adds up over a year.

  • Avoid complex bets: Parlays and “boosted” specials often have the highest hidden fees. Stick to single bets to keep the margin low.

  • Think in percentages: Always ask what the total probability is. If the numbers add up to a very high total, the house is taking a large slice of your potential win.

By understanding that odds are not just about sports but also about business, you can make clearer decisions. The goal is to find where the house is taking the smallest cut, giving you a better chance to keep your own winnings.