How Football Simulation Models Work — What Korea’s 77% World Cup Probability Actually Means

A figure of 77 percent sounds precise. It sounds like information. But understanding what a World Cup qualification probability actually represents — how it is generated, what assumptions sit behind it, and why two credible outlets can produce radically different assessments of the same team — is more analytically useful than the number itself.

Where the 77 Percent Comes From

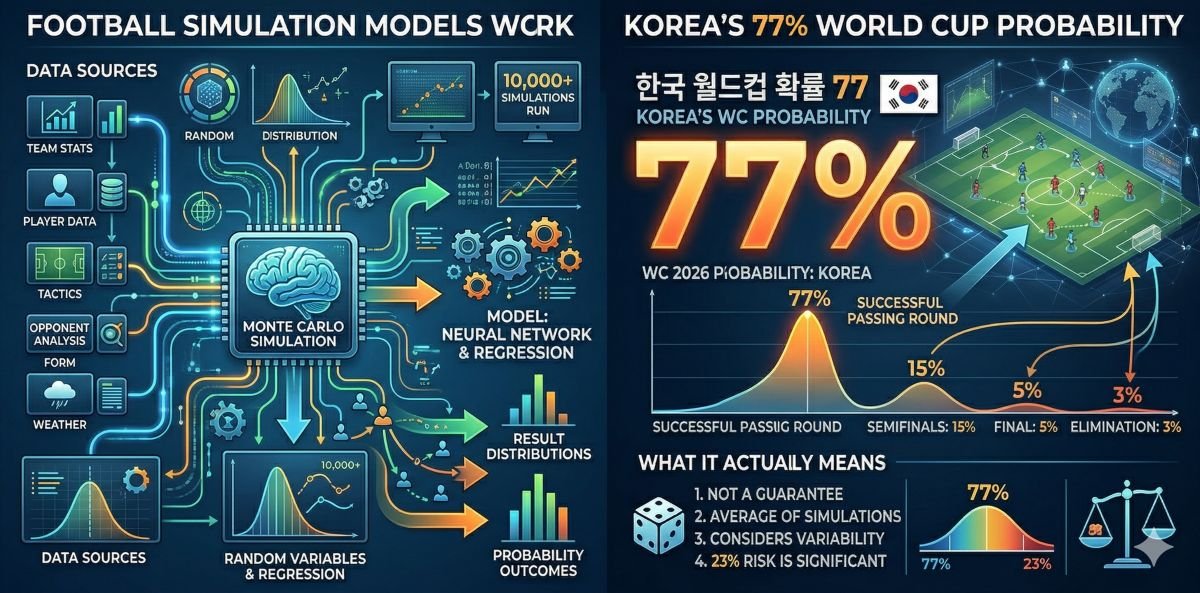
Football Meets Data, a soccer statistics media outlet, released simulation results showing South Korea has a 77 percent chance of advancing from Group A at the 2026 FIFA World Cup. Mexico leads the group at 90.3 percent. The Czech Republic sits at 55 percent and South Africa at 23 percent. Korea’s expected average points total across the group stage is 4.5, with the most likely individual outcomes being one win and two draws for five points, or one win, one draw, and one loss for four points.

These figures did not emerge from expert judgment or a single calculation. They are the output of a simulation model run across thousands — often tens of thousands — of individual tournament iterations. Understanding that production process is the starting point for interpreting the result correctly.

How Football Simulation Models Actually Work

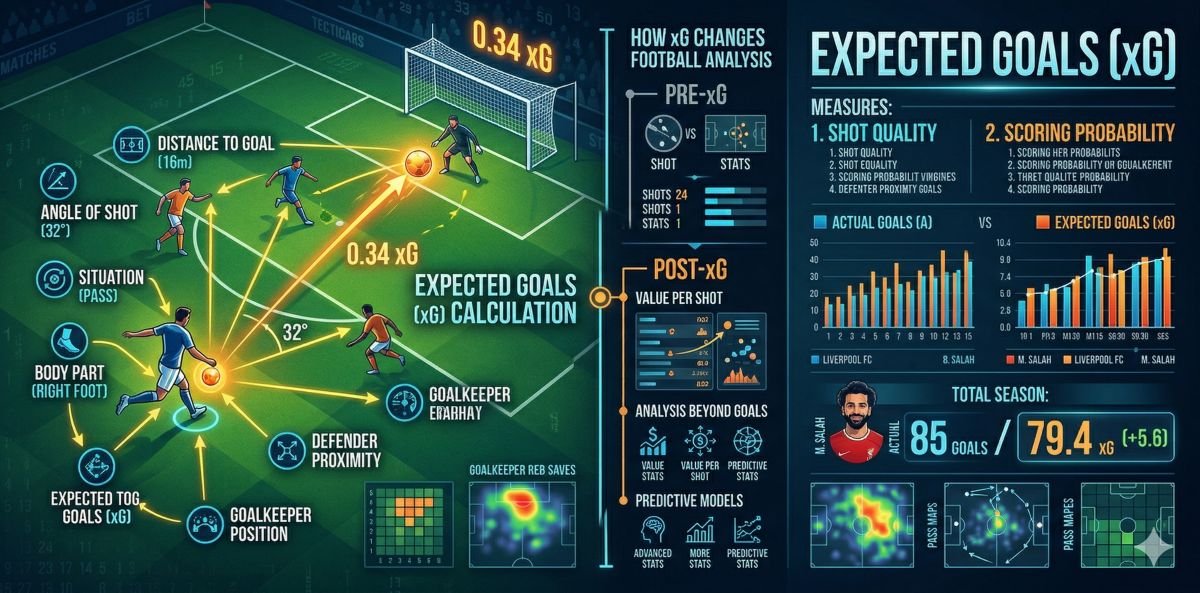
A football simulation model begins with team ratings. These ratings attempt to capture the overall quality of each team using historical match results, recent form, the strength of opponents faced, home and away performance records, and sometimes player-level data aggregated to the squad level. The rating system itself varies between providers — some use Elo-style systems that update continuously after each match, some use FIFA rankings as an input, some build proprietary models that blend multiple data sources.

Once team ratings are established, the model generates a match probability for each fixture in the tournament. Given Korea’s rating versus Czechia’s rating, the model estimates a probability distribution across three outcomes: a Korea win, a draw, or a Czechia win. These are not equal probability events — the ratings difference between the teams shifts the distribution.

The simulation then runs the tournament thousands of times. In each iteration, it uses those probability distributions to generate random outcomes within the defined probability space. So if Korea has a 45 percent chance of winning, a 30 percent chance of drawing, and a 25 percent chance of losing against Czechia, the simulation does not predict a Korea win — it generates a random outcome weighted toward those probabilities, then moves to the next match and does the same.

After running 10,000 or 100,000 iterations, the model counts the proportion of simulations in which Korea accumulated enough points to advance from Group A. That proportion is the 77 percent figure. It does not mean Korea is likely to advance. It means that in 77 out of every 100 simulated versions of this group stage, Korea accumulated sufficient points to go through.

What 77 Percent Does Not Mean

The most common misreading of probability outputs is treating them as predictions. A 77 percent advancement probability does not mean Korea will advance. It means that under the model’s assumptions, the scenarios in which Korea advances are substantially more common than the scenarios in which they do not. But the 23 percent of simulations in which Korea fails to advance are still happening — and in any individual real-world tournament, only one outcome occurs.

Put differently: if you ran the 2026 World Cup Group A stage 100 times with these teams at these rating levels, Korea would advance in approximately 77 of them. But this tournament is run once. The 77 percent is a statement about a distribution of possible outcomes, not a forecast of the specific outcome that will materialize.

This distinction matters practically for Korean fans assessing the team’s prospects. A 77 percent probability is meaningfully better than even odds — it indicates genuine structural advantage. But it coexists with a 23 percent probability of group stage elimination, and nothing in the simulation guarantees which scenario applies to June 2026.

Why The Athletic and The Guardian Disagree So Sharply

The most revealing illustration of simulation model limitations comes from the divergence in how different credible outlets have assessed South Korea ahead of the tournament. The Athletic ranked Korea 16th out of 48 World Cup teams, predicting advancement to the round of 32 and suggesting a realistic path to the round of 16. The Guardian ranked Korea 44th — near the bottom of the entire field — citing recent performances including a 0-4 loss to Ivory Coast and a 0-1 defeat to Austria, and raising concerns about tactical vulnerabilities under coach Hong Myung-bo.

Both outlets are credible. Both are working from publicly available information about the same team. The gap between 16th and 44th is not explained by one outlet being right and the other being wrong. It is explained by a more fundamental issue: the inputs determine the outputs.

A model that heavily weights historical track record — Korea’s eleven consecutive World Cup qualifications, their semifinal finish in 2002, their round of 16 appearances in 2010 and 2022 — will produce a substantially higher rating than a model that heavily weights recent form. A team with Korea’s history but recent warm-up match losses looks very different depending on how far back the evaluation window extends and how much it discounts or emphasizes recent results.

Neither weighting choice is objectively correct. They reflect analytical assumptions about what information is most predictive of future tournament performance. A historically grounded model argues that recent form in March friendly matches is a poor predictor of June World Cup performance. A recency-weighted model argues that the current tactical and physical state of the team matters more than what they achieved years ago. Both positions have legitimate analytical basis.

How Korea’s Tactical Profile Creates Model Complexity

South Korea’s playing style introduces additional complexity into how simulation models capture team quality. Korea under Hong Myung-bo plays a high-energy, pressing-oriented game built around organized defensive shape and rapid transitions through Son Heung-min’s pace and directness. This profile is effective against certain opposition types and potentially vulnerable against others.

Simulation models that use aggregate team ratings do not necessarily capture this stylistic dimension. A model might rate Korea as a 22nd-ranked team globally without encoding anything about how their high press interacts with technically proficient possession teams, or how their counter-attacking threat changes the calculus against defensively deeper opposition.

Korea’s opponents in Group A — Mexico, Czechia, and South Africa — have notably different stylistic profiles. Mexico’s possession-oriented play, Czechia’s disciplined European structure, and South Africa’s physical directness each interact with Korea’s tactical identity in ways that aggregate ratings cannot fully model. Whether that creates upside or downside for Korea depends on assessments that simulation models can only partially incorporate.

Reading Probability Outputs as a Calibrated Fan

The practical skill that makes all other football analytics more useful is learning to read probability outputs as model-dependent distributions rather than as predictions. When you see a 77 percent figure, the analytically useful response is to ask three questions: What inputs drove this number? How does this provider weight historical versus recent performance? What would change about the output if those assumptions shifted?

Comparing outputs across multiple models — the Football Meets Data simulation, The Athletic’s power ranking, The Guardian’s assessment — and understanding why they differ tells you more about Korea’s genuine uncertainty than any single figure can. A team that ranks 16th in one credible model and 44th in another is a team with genuinely contested prospects, where the outcome depends substantially on which version of Korea shows up in North America this summer.

For deeper analytical context on why even strong teams produce surprising results and how probability and variance interact in competitive sport, 분산과 변동성 데이터의 흔들림을 이겨내는 법 provides directly relevant framing on navigating statistical noise in sports analysis. For a Seongnam-focused look at how these analytical concepts apply to evaluating football performance at the club level, 2026 K League 2 Promotion and Relegation: A Guide for Seongnam FC Fans demonstrates how probabilistic thinking applies to domestic Korean football contexts.

The 77 percent probability for Korea is a useful piece of information. It is not a promise, not a forecast, and not a substitute for understanding what it means to be a team with genuine advancement probability playing in a group where elimination is far from impossible.

What Expected Goals (xG) Actually Measures — and How It Changes the Way Football Analysis Works

Expected Goals has become the metric that separates surface-level match analysis from genuine performance understanding. With the 2026 World Cup approaching and Korean football media increasingly using xG as a standard analytical reference, understanding what the number actually means — and what it does not mean — has become a practical necessity for engaged fans.

The Problem xG Was Designed to Solve

Football is structurally resistant to straightforward statistical analysis. It is a low-scoring sport where a single deflection, a goalkeeper error, or a moment of individual brilliance can produce a result that bears no relationship to the quality of football played across 90 minutes. Traditional statistics — shots on target, possession percentage, pass accuracy — capture activity without capturing quality. A team can hit the target five times with speculative efforts from 35 yards and be credited with five shots on target alongside a team that created five clear one-on-one opportunities. The raw number tells you nothing meaningful about which team actually played better.

Expected Goals addresses this problem by assigning a probability value to every shot. Rather than treating all shots as equivalent events, xG asks a more precise question: given where this shot was taken, at what angle, with what body part, and following what type of pass — how often would a shot from these exact circumstances result in a goal?

How the Model Is Built

The xG value for any given shot is calculated by comparing it to thousands of historical shots taken from similar positions and circumstances. Every variable that affects scoring probability is fed into the model. Location is the most significant factor — shots from directly in front of goal within the six-yard box have very high xG values because they convert frequently in historical data. Shots from wide angles near the byline have very low xG values because the geometry of the goal makes scoring from that position statistically rare regardless of the quality of the individual striker.

Additional variables layer onto the location calculation. Headers have lower xG than shots taken with the foot from equivalent positions because they convert less frequently. Shots following a through ball have higher xG than shots following a crossed delivery because the attacking player is typically in a better position relative to the goalkeeper. Set piece situations are modeled separately because the defensive positioning differs from open play. Whether the attacking player was under pressure from a defender at the moment of the shot is incorporated in more sophisticated versions of the model.

The result is a number between zero and one. An xG of 0.93 on a tap-in from three yards means that kind of chance results in a goal 93 percent of the time in historical data. An xG of 0.009 on a long-range strike from outside the area means that type of shot goes in roughly once every 111 attempts.

What xG Reveals That the Scoreline Does Not

The interpretive value of xG emerges most clearly when the metric and the result diverge. A team that loses 1-0 while generating 2.4 xG against an opponent that generated 0.4 xG has not simply been unlucky. It has been structurally dominant in terms of chance quality and has been beaten by a combination of clinical finishing, poor conversion, or goalkeeping performance that outstripped what historical averages would predict.

This distinction matters enormously for evaluation over time. A striker who scores eight goals from a position where his xG total was 14 is not in good form — he is underperforming his expected output significantly. A goalkeeper who has conceded five goals against a combined opponent xG of 9.5 has been saving shots at a rate that historical data suggests is either excellent or unsustainable depending on the sample size.

For Korean fans following the national team’s build-up to the 2026 World Cup, xG provides a framework for understanding the ongoing discussion around Son Heung-min’s international scoring record relative to his club output. The question of whether Korea is creating genuine high-quality chances internationally — or whether the team is generating volume without quality — is precisely the kind of question xG is designed to answer with more precision than goals or shots alone can provide.

The Difference Between xG Providers — and Why It Matters

One source of confusion for fans encountering xG across multiple platforms is that the same shot can be assigned different values by different data providers. Sofascore and Sky Sports, for instance, may display different xG figures for the same event in the same match. This is not an error — it reflects the fact that different providers use different models with different variables and different historical datasets.

Some models include goalkeeper positioning as a variable. Others do not. Some use larger historical datasets spanning multiple leagues and decades. Others are calibrated specifically to a single competition. The differences are usually small for typical shots but can diverge meaningfully for shots in unusual circumstances where the historical data is thin.

The practical implication is that xG values should be compared within the same provider’s data rather than across providers. A player’s seasonal xG total on one platform is meaningful in context. Comparing it to a different total from a different platform without knowing the model differences behind each is less useful.

Post-Shot xG and What It Adds

The basic xG model calculates the probability of a shot resulting in a goal before the shot is actually taken — based on position, context, and historical conversion rates from comparable situations. Post-shot xG, abbreviated as PSxG, extends the analysis by incorporating what actually happened during the shot itself.

Where basic xG tells you how likely a chance was to be scored based on circumstances before the shot, PSxG tells you how likely the specific shot that was produced was to result in a goal, accounting for placement within the goal frame and shot trajectory. A shot curled into the top corner from a tight angle might have a low basic xG because the position is difficult, but a high PSxG because the specific ball placed in that location was genuinely very hard to save. A shot hit directly at the goalkeeper from a clear central position might have a high basic xG but a low PSxG because the actual execution was poor.

PSxG is particularly useful for evaluating two positions. For goalkeepers, the gap between PSxG conceded and actual goals conceded measures how much they are saving shots that should statistically beat them. For strikers, consistent underperformance of basic xG — scoring fewer goals than the positions they reach would predict — can indicate finishing issues, but PSxG can reveal whether the problem is shot selection, execution, or simple statistical variance across a small sample.

For deeper analytical context on how statistical models function in sport and why even strong teams frequently produce results that diverge from what their quality suggests, 왜 강팀도 자주 패배하는가 provides directly relevant framing on probability and variance that underpins xG methodology. For a Seongnam-specific analytical case study applying these performance evaluation concepts to K League football, Understanding Football Player Ratings: A 2026 Seongnam FC Case Study demonstrates how these analytical frameworks apply in a local context.

xG does not predict the future. It does not tell you who will win the next match or whether a striker will score in the next game. What it does is provide a more honest account of the past — separating what happened from what the underlying quality of play suggested should have happened, and giving analysts, coaches, and engaged fans a more reliable foundation for evaluation than the scoreline alone can offer.

2026 K League 2 Promotion and Relegation: A Guide for Seongnam FC Fans

The 2026 K League 2 season marks a fundamental shift in the landscape of South Korean football. For years, the second division operated as a somewhat insulated environment where the primary focus was looking upward toward the top flight. That changed this year with the historic introduction of movement between K League 2 and the K3 League. This new layer of consequence means that every match involves a calculation of survival, not just ambition.

For a club like Seongnam FC, a pillar of football in Gyeonggi-do, the stakes have shifted from a simple desire for promotion to a multi-front battle. Understanding the mechanics of this system is the only way to make sense of the tension currently felt at Tancheon Sports Complex.

The Race for the Top: Automatic Promotion

The most straightforward path to K League 1 remains the most difficult to achieve. In 2026, the reward for consistency is higher than ever, as the top two teams in K League 2 earn automatic promotion. In previous cycles, only the champion was guaranteed a spot, forcing the runner-up into a volatile playoff against a K League 1 side.

By doubling the automatic promotion slots, the league has incentivized aggressive, win-oriented strategies. For Seongnam FC, finishing in these top two spots isn’t just about prestige, it is about financial security. Skipping the playoff rounds allows a club to begin its top-flight recruitment and budgeting weeks earlier than those stuck in the post-season tournament.

The Playoff Gauntlet: Third through Sixth

Below the top two, the league enters a high-stakes knockout phase. Teams finishing third, fourth, fifth, and sixth enter a promotion playoff structure. This is where the table position becomes a tactical weapon. The higher a team finishes within this bracket, the more advantages they receive, such as home-field preference and the “draw-advance” rule, where the higher-seeded team moves on if the match ends in a tie after regulation.

This structure creates a “league within a league.” A team in fourth place isn’t just playing to win, they are playing to catch the third-place team to secure a home match. For supporters, watching the point gap between sixth and seventh place is now just as important as watching the title race. One lapse in concentration in September can be the difference between a shot at the big leagues and another year in the second division.

The New Threat: K3 League Relegation

While the top of the table fights for glory, the bottom of the table is now a site of genuine peril. For the first time, the bottom-placed K League 2 club faces a direct threat from below. The team finishing last must defend its professional status in a single-match playoff against the K3 League champion.

This match is held at the home stadium of the K League 2 club, providing a slight geographic advantage, but the psychological pressure is immense. In this scenario, the K3 side plays with the house money of a potential historic upset, while the K League 2 side plays with the weight of a potential collapse. This addition ensures that matches between bottom-tier clubs in the final weeks of the season are no longer “dead rubbers” but desperate fights for professional relevance.

Why Position Matters More Than Ever

In this restructured environment, the league table is no longer just a list of who is winning, it is a map of risk and reward. Every rung on the ladder offers a different level of protection or opportunity. This is particularly true when analyzing how teams react to the pressure of the new system.

When a team like Seongnam FC finds itself in a mid-table scramble, the leadership must decide whether to pivot toward a defensive stance to avoid the bottom-tier playoff or to overextend for a top-six finish. These decisions are often influenced by how the club perceives its own stability and the fairness of the results they’ve seen so far. Interestingly, many supporters and even players often struggle with how a well-run team can still find itself in a relegation scrap. You can find a deeper look into why systems feel rigged early on to understand the psychological side of these table shifts.

The Seongnam FC Context

Seongnam’s position is unique because of its history and resources. As a club that has tasted continental glory, the pressure to occupy the top two spots is constant. However, the 2026 system punishes clubs that rely on reputation over current data. If the team falls into the third-to-sixth-place bracket, they enter a territory where variance and luck play a much larger role than they do in the 36-game regular season.

In short-tournament formats like the promotion playoffs, a single refereeing decision or a deflected shot can undo months of tactical discipline. This is why the push for automatic promotion is so frantic. The goal is to escape the “noise” of the playoffs entirely. For those interested in the math behind why these high-stakes matches often feel so unpredictable, it’s worth exploring the limits of probability in single event outcomes.

Conclusion

The 2026 K League 2 season has successfully removed the “boring” middle of the table. By adding a second automatic promotion spot and a relegation playoff at the bottom, the K League has ensured that almost every team has something to play for until the final whistle of the final day. For Seongnam FC, the mission is clear: stay out of the chaos of the playoffs and the danger of the basement. In this new era, the table isn’t just a record of the past, it’s a predictor of a club’s survival.

For further reading on the regional context of these changes, you can see how 법적 구조가 이용자 행동을 형성하는 방식 in the sports industry across different cities.