
What Expected Goals (xG) Actually Measures — and How It Changes the Way Football Analysis Works
Expected Goals has become the metric that separates surface-level match analysis from genuine performance understanding. With the 2026 World Cup approaching and Korean football media increasingly using xG as a standard analytical reference, understanding what the number actually means — and what it does not mean — has become a practical necessity for engaged fans.
The Problem xG Was Designed to Solve
Football is structurally resistant to straightforward statistical analysis. It is a low-scoring sport where a single deflection, a goalkeeper error, or a moment of individual brilliance can produce a result that bears no relationship to the quality of football played across 90 minutes. Traditional statistics — shots on target, possession percentage, pass accuracy — capture activity without capturing quality. A team can hit the target five times with speculative efforts from 35 yards and be credited with five shots on target alongside a team that created five clear one-on-one opportunities. The raw number tells you nothing meaningful about which team actually played better.
Expected Goals addresses this problem by assigning a probability value to every shot. Rather than treating all shots as equivalent events, xG asks a more precise question: given where this shot was taken, at what angle, with what body part, and following what type of pass — how often would a shot from these exact circumstances result in a goal?
How the Model Is Built
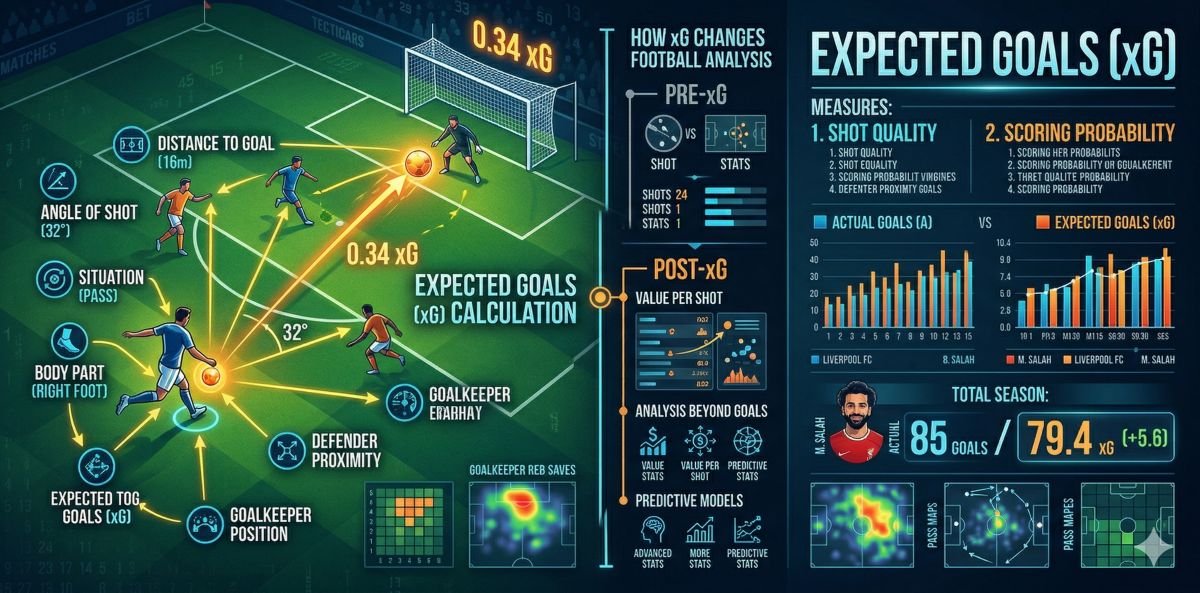
The xG value for any given shot is calculated by comparing it to thousands of historical shots taken from similar positions and circumstances. Every variable that affects scoring probability is fed into the model. Location is the most significant factor — shots from directly in front of goal within the six-yard box have very high xG values because they convert frequently in historical data. Shots from wide angles near the byline have very low xG values because the geometry of the goal makes scoring from that position statistically rare regardless of the quality of the individual striker.
Additional variables layer onto the location calculation. Headers have lower xG than shots taken with the foot from equivalent positions because they convert less frequently. Shots following a through ball have higher xG than shots following a crossed delivery because the attacking player is typically in a better position relative to the goalkeeper. Set piece situations are modeled separately because the defensive positioning differs from open play. Whether the attacking player was under pressure from a defender at the moment of the shot is incorporated in more sophisticated versions of the model.
The result is a number between zero and one. An xG of 0.93 on a tap-in from three yards means that kind of chance results in a goal 93 percent of the time in historical data. An xG of 0.009 on a long-range strike from outside the area means that type of shot goes in roughly once every 111 attempts.
What xG Reveals That the Scoreline Does Not
The interpretive value of xG emerges most clearly when the metric and the result diverge. A team that loses 1-0 while generating 2.4 xG against an opponent that generated 0.4 xG has not simply been unlucky. It has been structurally dominant in terms of chance quality and has been beaten by a combination of clinical finishing, poor conversion, or goalkeeping performance that outstripped what historical averages would predict.
This distinction matters enormously for evaluation over time. A striker who scores eight goals from a position where his xG total was 14 is not in good form — he is underperforming his expected output significantly. A goalkeeper who has conceded five goals against a combined opponent xG of 9.5 has been saving shots at a rate that historical data suggests is either excellent or unsustainable depending on the sample size.
For Korean fans following the national team’s build-up to the 2026 World Cup, xG provides a framework for understanding the ongoing discussion around Son Heung-min’s international scoring record relative to his club output. The question of whether Korea is creating genuine high-quality chances internationally — or whether the team is generating volume without quality — is precisely the kind of question xG is designed to answer with more precision than goals or shots alone can provide.
The Difference Between xG Providers — and Why It Matters
One source of confusion for fans encountering xG across multiple platforms is that the same shot can be assigned different values by different data providers. Sofascore and Sky Sports, for instance, may display different xG figures for the same event in the same match. This is not an error — it reflects the fact that different providers use different models with different variables and different historical datasets.
Some models include goalkeeper positioning as a variable. Others do not. Some use larger historical datasets spanning multiple leagues and decades. Others are calibrated specifically to a single competition. The differences are usually small for typical shots but can diverge meaningfully for shots in unusual circumstances where the historical data is thin.
The practical implication is that xG values should be compared within the same provider’s data rather than across providers. A player’s seasonal xG total on one platform is meaningful in context. Comparing it to a different total from a different platform without knowing the model differences behind each is less useful.
Post-Shot xG and What It Adds
The basic xG model calculates the probability of a shot resulting in a goal before the shot is actually taken — based on position, context, and historical conversion rates from comparable situations. Post-shot xG, abbreviated as PSxG, extends the analysis by incorporating what actually happened during the shot itself.
Where basic xG tells you how likely a chance was to be scored based on circumstances before the shot, PSxG tells you how likely the specific shot that was produced was to result in a goal, accounting for placement within the goal frame and shot trajectory. A shot curled into the top corner from a tight angle might have a low basic xG because the position is difficult, but a high PSxG because the specific ball placed in that location was genuinely very hard to save. A shot hit directly at the goalkeeper from a clear central position might have a high basic xG but a low PSxG because the actual execution was poor.
PSxG is particularly useful for evaluating two positions. For goalkeepers, the gap between PSxG conceded and actual goals conceded measures how much they are saving shots that should statistically beat them. For strikers, consistent underperformance of basic xG — scoring fewer goals than the positions they reach would predict — can indicate finishing issues, but PSxG can reveal whether the problem is shot selection, execution, or simple statistical variance across a small sample.
For deeper analytical context on how statistical models function in sport and why even strong teams frequently produce results that diverge from what their quality suggests, 왜 강팀도 자주 패배하는가 provides directly relevant framing on probability and variance that underpins xG methodology. For a Seongnam-specific analytical case study applying these performance evaluation concepts to K League football, Understanding Football Player Ratings: A 2026 Seongnam FC Case Study demonstrates how these analytical frameworks apply in a local context.
xG does not predict the future. It does not tell you who will win the next match or whether a striker will score in the next game. What it does is provide a more honest account of the past — separating what happened from what the underlying quality of play suggested should have happened, and giving analysts, coaches, and engaged fans a more reliable foundation for evaluation than the scoreline alone can offer.