The Hidden Traps in Reading Odds

Odds appear to communicate one thing clearly — the probability of an outcome — but what they actually communicate is more layered, and the gap between the two is where most misreading occurs.

The surface presentation of odds is clean. A number is displayed. That number implies a likelihood. A participant looks at the number, forms a judgment, and decides whether to act. The process feels straightforward because the interface is simple. The simplicity is the trap. Odds are not neutral probability estimates. They are constructed figures that embed multiple variables simultaneously, and reading them as though they represent only one variable produces systematic errors that compound over time.

Understanding the hidden traps in reading odds does not require advanced mathematics. It requires clarity about what odds actually are, what they include that most readers ignore, and what cognitive tendencies make accurate interpretation consistently difficult.

The Probability Conversion Error

The first and most common trap is treating implied probability as actual probability without examining the source of the difference between them.

Converting odds to implied probability is arithmetically simple — divide one by the decimal odds, or apply the equivalent conversion for other formats. The resulting figure is often interpreted as the market’s estimate of the true probability of that outcome. This interpretation is wrong, or at least incomplete, because the implied probability extracted from any set of odds includes the operator’s margin. That margin means the implied probabilities across all outcomes in a market sum to more than one hundred percent.

The overround — the amount by which the total implied probability exceeds certainty — represents built-in cost. In a two-outcome market with a five percent overround, the implied probabilities might sum to one hundred and five percent. Treating either implied probability figure as a clean estimate of true probability overstates the operator’s assessment of that outcome by a portion of that margin. The scale of this error varies with the size of the margin and the structure of the market, but it is always present and almost always ignored in casual reading.

The Favorite-Longshot Bias

The second trap operates at the level of how odds are perceived rather than how they are calculated. Decades of research across multiple domains has consistently documented that participants systematically overvalue low-probability outcomes and undervalue high-probability outcomes when making decisions involving risk.

In the context of odds reading, this manifests as a tendency to find longshot odds more attractive than their implied probability warrants and to underestimate the value embedded in shorter-priced outcomes. A large potential return on a small outlay feels compelling in a way that is disconnected from the actual probability the odds imply. The emotional weight of a large number in the return column distorts the assessment of whether the implied probability is accurate.

This bias is not corrected by awareness alone. As examined in Seongnam Insider’s framework for identifying the hidden traps in reading odds, the cognitive mechanisms that produce this distortion operate below the level at which deliberate reasoning typically intervenes — which is why it persists even among experienced participants who are explicitly aware of its existence.

Anchoring to the Opening Price

The third trap involves how the history of a price influences its current interpretation. When odds move from an opening figure to a current figure, participants naturally use the opening price as a reference point. A market that opened at 3.00 and has moved to 2.20 is interpreted differently than one that has been stable at 2.20 throughout — even though the current odds in both cases communicate exactly the same implied probability.

The anchoring effect means that movement is interpreted as signal even when it may reflect factors unrelated to the true probability of the outcome — sharp money on one side, a news event that has already been widely absorbed, a structural adjustment to balance the book. Reading the current odds through the lens of where they started introduces a layer of interpretation that the odds themselves do not support.

The Framing of Outcomes

A fourth trap, less discussed but equally consequential, is how the framing of an odds market affects which outcomes receive attention and how their probabilities are assessed relative to each other.

Markets are structured around defined outcomes, and the outcomes that appear on a market interface are not a neutral representation of everything that could happen. They are a selection — the outcomes the operator has chosen to price. The outcomes that are not priced, or that are bundled into catch-all categories, receive less cognitive attention simply because they are not presented as discrete choices.

Why the Unlisted Outcome Matters

This creates a consistent blind spot. Participants assess the outcomes they can see and allocate probability mentally across them, often without adequately accounting for the probability mass that resides in scenarios the market has not individually priced. In complex markets — correct score, multi-event accumulators, player performance specials — the gap between the outcomes that are priced and the full distribution of possible results is wide, and that gap is systematically underweighted by participants who are responding to the framing rather than the underlying probability landscape.

Reading Odds as a Skill

The practical implication of these traps is that reading odds accurately is a learned skill rather than a natural response to a clear signal. The number displayed is real. The implied probability it generates is calculable. But interpreting that probability correctly — accounting for the margin, resisting the distortion of large returns, avoiding anchoring to historical prices, and recognizing the framing effects of how markets are structured — requires active cognitive effort that the simplicity of the display does not prompt.

For a deeper structural analysis of how odds are constructed before they are ever read, Seoul Monthly’s examination of the layered process behind odds formation provides useful context on the forces that shape the figures participants encounter — and why those figures should never be taken at face value.

Why Early Losses Feel Personal

Why Early Losses Feel Personal

Introduction

There is a specific quality to the distress that comes from losing early in any new system. It does not feel like the neutral outcome of a probabilistic process. It feels like a verdict. The loss arrives with a sense of meaning attached to it — as if the outcome says something definitive about the person who experienced it, rather than simply reflecting the statistical distribution of results that any competitive environment produces for new participants.

This feeling is nearly universal, and it is nearly universally inaccurate. Understanding why early losses feel personal requires looking at the specific cognitive mechanisms that transform an objectively impersonal outcome into a subjectively charged one — and why those mechanisms operate with particular force at the beginning of any new engagement.

Loss Aversion and the Asymmetry of Experience

The psychological foundation of why early losses feel personal begins with loss aversion — one of the most consistently documented findings in behavioral economics. First identified by Daniel Kahneman and Amos Tversky in their development of prospect theory, loss aversion describes the well-established asymmetry in how gains and losses are emotionally processed: the pain of a loss is psychologically approximately twice as powerful as the pleasure of an equivalent gain.

This asymmetry means that losing 10,000 won does not feel like the mirror image of winning 10,000 won. It feels significantly worse. The emotional register of a loss is more intense, more memorable, and more cognitively intrusive than an equivalent gain. When early experiences in a new system consist predominantly of losses — as they typically do, for the straightforward reason that beginners have less skill and knowledge than experienced participants — the emotional weight of those losses is doubled relative to what any equivalent gains would have produced.

This creates a distorted picture of the early experience. A run of losses followed by an equal run of gains does not produce emotional neutrality. It produces net negative affect, because the losses registered more powerfully than the gains that followed. The system that produced these outcomes is operating entirely neutrally. The experience of those outcomes is anything but.

Self-Attribution Bias: Turning Outcomes Into Verdicts

Loss aversion explains why losses feel bad. Self-attribution bias explains why they feel personal. This cognitive pattern describes the systematic tendency to attribute positive outcomes to internal factors — skill, judgment, capability — while attributing negative outcomes to external factors when they belong to someone else, but to internal factors when they belong to oneself.

The mechanics of this bias operate differently for beginners than for experienced participants. Research on attributional biases consistently shows that people attribute their own failures to internal causes — lack of ability, poor judgment, fundamental inadequacy — more readily when they lack the experience base to identify plausible external explanations. An experienced participant who loses can draw on a detailed contextual understanding to attribute the loss to specific external factors: a particular configuration of odds, an unusual run of variance, an identifiable error in approach that can be corrected. A beginner who loses lacks that contextual understanding and defaults instead to a global internal attribution: the loss happened because of something wrong with them as a person.

This is compounded by the loss aversion dynamic and why losing experiences register more intensely than gaining experiences. The emotional intensity of the loss drives a search for meaning — because intense experiences demand explanation — and the most available explanation for a beginner is the personal one. Without the experience to identify external causes accurately, the mind fills the explanatory gap with self-referential interpretation.

The Reference Point Problem

Early losses feel personal partly because of where the beginner’s reference point is set. People do not evaluate outcomes in absolute terms. They evaluate them relative to a reference point — typically an expectation of what the outcome should have been. For a beginner entering a new system, the reference point is often set by observation of experienced participants. They have watched others navigate the system successfully, formed an implicit expectation of what participation should look like, and interpreted their own early results against that expectation.

When early results consistently fall below that expectation, the gap produces what Kahneman and Tversky’s prospect theory describes as a loss experience — not in absolute terms, but relative to the expected reference level. The beginner who expected to perform at a level they observed in experienced participants and instead loses repeatedly is experiencing a continuous series of reference-point failures, each of which registers with the full emotional weight that loss aversion assigns to outcomes below expectation.

This reference point mismatch is a structural feature of every new engagement, not a personal failing. The experienced participant’s apparent ease was built over many sessions of exactly the kind of early losses the beginner is now experiencing. The gap between observed competence and current performance is not a sign that something is wrong with the beginner. It is the normal distance between the starting point and the destination.

Why the Feeling Persists Even After Understanding

One of the more frustrating features of knowing about loss aversion and self-attribution bias is that the knowledge does not automatically neutralize the emotional experience. Understanding intellectually that early losses are statistically expected does not prevent them from feeling significant when they arrive. The emotional processing system operates faster than the analytical one, and the feeling of personal verdict tends to precede any rational reassessment.

What the understanding does provide, however, is an interpretive framework that can override the initial emotional attribution once it appears. The beginner who knows that early losses feel more significant than they are can recognize the feeling as a predictable cognitive response rather than an accurate signal about their capability. They can ask: is this loss telling me something specific and correctable about my approach, or is it simply the statistical output of early-stage participation in a system that requires time to learn?

That question does not eliminate the discomfort. But it redirects attention from a global personal verdict — which produces paralysis and withdrawal — toward a specific diagnostic inquiry, which produces learning and improvement.

Final Thoughts: The Loss Is Not the Lesson

Early losses feel personal because of loss aversion, self-attribution bias, and reference point mismatch — three cognitive mechanisms that are entirely normal features of human psychology, not indicators of unusual sensitivity or fragility. The losses themselves are not personal. They are the expected output of the early stage of any learning curve, registered by a mind that was never designed to process outcomes with the statistical neutrality they deserve.

Recognizing this does not make the losses stop. It makes them mean something more useful: not a verdict on capability, but a data point on the distance still to travel.

The loss is not evidence of who you are. It is part of the cost of learning where you are.

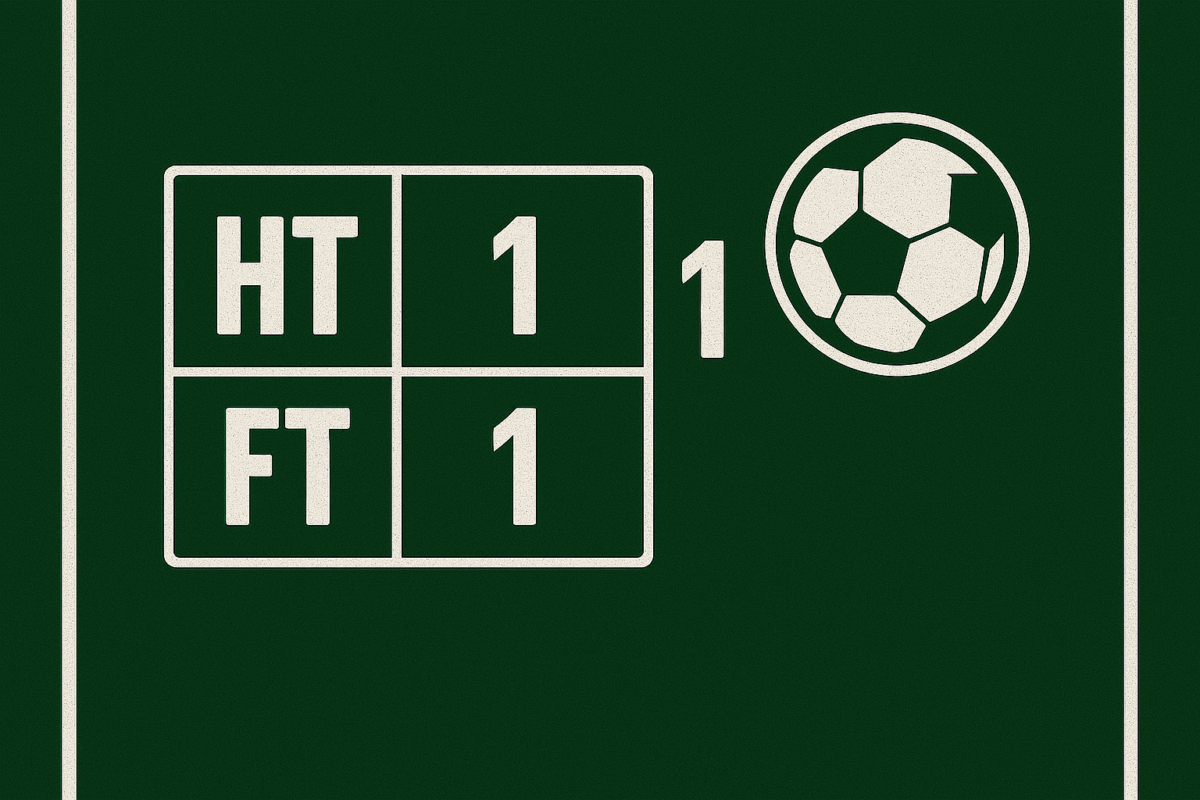
How HT/FT Bets Are Settled: A Complete Guide for Bettors

The appeal of HT/FT betting is straightforward: higher odds, more specific predictions, and the structural interest of tracking a match across both halves. The settlement mechanics, however, are more nuanced than a standard match result market, and misunderstanding them is one of the most common sources of confusion and frustration for participants who are new to this format.

Understanding how HT/FT bets are settled covers more ground than simply knowing what the nine possible outcome combinations are. It requires understanding exactly what counts as halftime and fulltime for settlement purposes, how abandoned and postponed matches affect the bet, how extra time is handled, and what platform-specific rules can vary across different operators. This guide addresses each of these dimensions in practical terms.

The Basic Settlement Principle

An HT/FT bet is won only when both components of the prediction — the halftime result and the fulltime result — match the actual outcome of the match. There is no partial credit. A correct halftime prediction combined with an incorrect fulltime prediction settles as a loss. A correct fulltime prediction combined with an incorrect halftime prediction also settles as a loss. Both must be right simultaneously for the bet to win, which is the structural reason these markets carry higher odds than single-result alternatives.

Settlement is based on the official result at the end of 90 minutes plus referee-added stoppage time — what is formally termed regulation time. This is the same reference point used for standard 1X2 match result markets. The halftime result is determined at the official end of the first 45 minutes plus first-half stoppage time. Both components are settled based on these official timepoints, not on the score at any other moment during the match.

Extra Time and Penalties

One of the most important settlement rules for HT/FT bets — and one that is most frequently misunderstood — is the treatment of extra time and penalty shootouts.

For football matches, HT/FT bets are settled based on regulation time only. Extra time and penalties do not count. If a match proceeds to extra time following a draw at 90 minutes, the HT/FT bet has already been settled based on the regulation time result, regardless of what happens afterward. A participant who correctly predicted the halftime result and the 90-minute result has won their bet at the final whistle, irrespective of whether the match subsequently goes to a penalty shootout in a cup competition.

This rule applies consistently across virtually all major platforms. The HT/FT market is a regulation-time market. Participants who are used to markets that include extra time — such as some outright winner markets in knockout competitions — should be aware that the HT/FT format does not extend into additional playing time.

The treatment differs slightly in certain American sports where HT/FT is offered. In basketball and American football, where overtime is a regular feature rather than an exception, some operators explicitly state that their HT/FT market includes overtime. This is not the case for football, but it is worth checking operator-specific rules when HT/FT markets are offered on unfamiliar sports formats.

Abandoned Matches

Abandoned matches are among the most complex settlement scenarios in any betting market, and HT/FT is no exception. The general principle is that if a match is abandoned before the relevant component has been completed, the HT/FT bet is void and the stake is returned.

If a match is abandoned during the first half — before halftime has been reached — neither component of the HT/FT prediction has been settled, and the entire bet is void. If a match is abandoned after halftime but before fulltime, the halftime component has been established but the fulltime component has not been determined. In this scenario, the standard rule across most major operators is that the entire HT/FT bet is void, since both components must be established for settlement to occur.

The timeline for completion also matters. Most operators apply a 24-hour or 48-hour window within which the match must resume and be completed for bets to stand. If the match is completed within that window, bets are typically settled normally. If it is not completed within the window, bets are voided and stakes returned. Some operators extend this to five days for rescheduled rather than abandoned fixtures. The exact terms vary by platform and should be confirmed in the operator’s specific settlement rules before placing bets on matches with a meaningful risk of abandonment — particularly outdoor events in weather-affected environments.

Postponed Matches

A postponed match — one that does not start at its scheduled time — is treated differently from an abandoned match in most jurisdictions. If a match does not kick off and is rescheduled within a short window (typically three to five days, depending on the operator), bets generally stand and are settled when the rescheduled match is played. If the match is rescheduled beyond that window, most operators void the bet and return the stake.

For HT/FT bets specifically, the postponement rules are the same as for other pre-match markets on the same event. The HT/FT nature of the bet does not create special postponement treatment — the general postponement policy of the platform applies.

How Settlement Interacts with the Structural Risk of Combined Odds

As analyses of the structural risks embedded in HT/FT combined odds formats document, the requirement for both components to be correct simultaneously creates a compounded settlement risk that goes beyond what either component would carry independently. Understanding this interaction matters for settlement specifically because it clarifies why a near-miss — a correct halftime call and an incorrect fulltime call — represents a complete loss rather than a partial return.

This all-or-nothing settlement structure is not punitive — it is the logical consequence of how the odds are priced. The higher odds on HT/FT combinations reflect the fact that both components must align for a return to be generated. If partial credit were available, the odds would be substantially lower, and the market would function differently. Participants who understand this structure before placing bets are less likely to be surprised when a match goes according to plan through the first half but diverges from their prediction in the second.

Platform-Specific Rules to Check

While the core settlement principles described above apply broadly, there are platform-specific variations that participants should verify before committing to HT/FT bets on any new operator. The most important variables to confirm are the treatment of overtime in non-football sports, the completion window for abandoned matches, the postponement window, and any specific rules relating to matches in competitions where the format can differ from standard league play — such as knockout tournament matches where extra time may be scheduled.

Most operators publish their settlement rules in a dedicated sports rules or betting rules section. The settlement terms for specific markets — including HT/FT — are almost always available there. Reading these before placing the first bet in a new market is not excessive caution. It is the straightforward way to avoid the kind of settlement outcome that comes as an unwelcome surprise.

Final Thoughts

HT/FT bets settle on regulation time only, require both components to be correct simultaneously, and follow the same abandoned and postponed match rules as other pre-match markets on the same event. Understanding these mechanics before engaging with the market is part of engaging with it intelligently — because the settlement rules are as much a part of the bet’s risk profile as the odds themselves.

Knowing how a bet settles is as important as knowing what you are predicting.

How Period-Based Sports Affect Bet Outcomes

Most sports are divided into segments — halves, quarters, or periods — but not all of them treat those divisions the same way for wagering purposes. Period-based sports like ice hockey, basketball, and American football create a specific betting environment where the structure of the competition itself directly shapes the range of markets available, the way odds are priced, and the particular analysis required to engage with those markets productively.

Understanding how period-based sports affect bet outcomes is not simply a matter of knowing that period markets exist. It requires understanding how the periodic structure changes the statistical distribution of outcomes, how intermissions reset competitive dynamics, and why period-specific analysis differs from full-game analysis in ways that matter for any serious evaluation of these markets.

The Structure of Period-Based Competition

A period-based sport divides its total playing time into discrete, separated segments with formal breaks between them. Ice hockey uses three twenty-minute periods separated by fifteen-minute intermissions. Basketball uses four twelve-minute quarters in the NBA, each separated by short breaks with a longer halftime interval between the second and third quarters. American football has four quarters with a halftime break.

These breaks are not merely rest intervals. They are structural resets. Coaches adjust tactics, players recover from physical and mental fatigue, momentum built in the preceding period dissipates, and both teams begin the next period from a position that is partially — not fully — defined by what preceded it. The competitive state of the game carries over in terms of score; the competitive momentum does not carry over with the same force.

This reset effect creates a scoring distribution for individual periods that is statistically more compressed and more independent of previous periods than a continuous game format would produce. Research on scoring dynamics in professional sports has found that scoring rates within periods are remarkably consistent across different stages of a game, but change significantly at period boundaries as teams and players recalibrate. The intermission acts as a partial statistical independence point between periods.

How Period Markets Are Priced Differently

The most direct consequence of the period structure for wagering is that period-specific markets carry substantially different odds from full-game equivalents, and for mathematically coherent reasons.

A team that is a -7.5 point favorite in the full game will typically be only a -2 to -2.5 point favorite in a single quarter. The spread compression reflects the reduced time window and the higher variance that a shorter segment produces. Over fewer minutes, the probability that the underdog outscores the favorite in that specific segment is meaningfully higher than their probability of winning the full game — not because their underlying ability has changed, but because variance increases as the sample window shrinks. The same principle applies to moneyline odds: a team with full-game moneyline odds of -255 will appear much closer to even money in a single quarter, because the outcome of one twelve-minute segment is far less predictable than the outcome of forty-eight minutes.

This pricing structure has a practical implication for analysis. Period markets reward accuracy about short-burst performance patterns rather than sustained quality across a full game. As explored in analyses of how momentum and win probability interact across segments of live sports, the relationship between pre-period momentum and within-period performance is not as strong as many participants assume. A team that dominated the previous period does not carry the same statistical advantage into the next that its recent performance might suggest — because the intermission has partially reset the conditions that produced that dominance.

The Intermission Reset and Its Analytical Implications

The intermission is the defining feature of period-based sports that separates them analytically from continuous-time formats like football (soccer). In a continuous format, momentum accumulates or dissipates in real time, and the scoring probability at any given minute is influenced by the recent trajectory of the contest. In a period-based format, the intermission introduces a deliberate break in that trajectory.

Tactically, this means that a team that was clearly outplayed in the first period has had a formal opportunity to reorganize, adjust their defensive structure, and enter the second period with a new tactical plan. Their probability of performing better in the second period is systematically higher than a simple extrapolation from first-period performance would suggest, because the reset has compressed the advantage the dominant team accumulated.

This regression toward the mean across periods is one of the most consistent statistical patterns in period-based sports. Teams that score significantly above their average rate in one period tend to score closer to their average in the subsequent period, and teams that significantly underperform tend to perform closer to their average after the break. The intermission is the mechanism that produces this regression, by disrupting the momentum dynamics that generated the first-period performance.

For period market analysis, this means that first-period results are weaker predictors of second-period outcomes than full-game results are predictors of future full-game performance. The structural reset attenuates the predictive signal. Participants who treat strong first-period performance as strong predictive evidence for second-period dominance are applying a model that the period-based structure actively undermines.

Overtime and Its Settlement Implications

Period-based sports have unique overtime structures that create specific settlement considerations for wagerers. Ice hockey in the NHL uses a five-minute three-on-three overtime period followed by a shootout if the score remains tied. Basketball uses five-minute overtime periods that continue until a winner is determined. American football uses a fifteen-minute overtime period with specific possession rules.

For full-game wagering, the key question is whether the bet includes overtime. In hockey, the 60-minute line — a regulation-time market explicitly excluding overtime and shootouts — is a distinct market from the standard moneyline, which includes overtime. Participants who do not distinguish between these markets can find that a bet they believed covered regulation play extends into overtime, or vice versa.

For period-specific bets, overtime does not affect the settlement of individual period markets — those bets close at the end of the relevant period regardless of what follows. The third-period result in hockey, for instance, is settled at the end of regulation time for that period; a goal scored in overtime does not retroactively affect a third-period over/under.

What Period Analysis Actually Requires

Effective analysis of period-based sports markets requires a different analytical framework from full-game analysis. Rather than asking which team is better overall, the relevant questions are how each team performs in specific period positions — whether they are slow starters who build into games, whether they are stronger in third periods due to depth and conditioning advantages, and whether the intermission reset tends to neutralize their first-period advantages or disadvantages.

These period-specific tendencies are documented in team statistics but are often underweighted by participants who apply full-game thinking to period markets. The team with the better overall season record may not be the team with the better first-period record. The team with the strongest second-half performance may have a systematically weaker third period relative to expectations. These are distinct patterns that period-based sports produce, and they require period-specific data to evaluate accurately.

Final Thoughts

Period-based sports affect bet outcomes by creating intermission resets that redistribute competitive momentum, generating period-specific markets with structurally different odds from full-game equivalents, and requiring analysis that accounts for the regression toward the mean that the break structure produces. Applying full-game analysis to period markets produces predictable analytical errors, because the two formats operate under different competitive dynamics that the structural break between periods creates.

In period-based sports, the break is not a pause in the action. It is part of the competition.

How Rule Differences Shape Betting Markets

The structure of a sports market is not designed by analysts — it is imposed by the rulebook of the sport it covers.

This is one of the less obvious truths about how sports markets are built and why they behave so differently from one discipline to the next. A football market and a basketball market covering events happening simultaneously on the same day are not variations of the same product. They are structurally distinct constructs shaped by entirely different sets of rules governing how play progresses, how scoring occurs, how time is managed, and how the competitive balance of a match can shift. Every one of those rule differences has a downstream consequence for how markets are designed, how odds are calculated, and how participants experience the activity of engaging with them.

Understanding how rule differences shape markets requires moving beyond the surface similarities — both involve teams, both have outcomes, both generate odds — and examining the mechanical layer underneath, where sport-specific rules translate directly into market-specific constraints and opportunities.

Scoring Frequency and Market Granularity

The most immediate way that sport rules influence market structure is through scoring frequency. How often points are scored in a typical match determines how much granular market variety is possible and how quickly odds must move to remain accurate.

Football operates at low scoring frequency. A ninety-minute match might produce two or three goals, and significant stretches of play can pass without any scoreline change. This low-event environment has historically made certain market types structurally simpler — correct score markets involve a relatively small number of plausible outcomes, and the match result market remains stable across long stretches of play. The tradeoff is that each individual scoring event carries enormous weight in probability terms, causing sharp odds movements when a goal occurs.

Basketball operates at extremely high scoring frequency. Scores change dozens of times per match, and the lead can shift multiple times within a single minute. This environment makes certain market formats unstable — a correct score market would be practically unusable — while enabling others. Spread markets, quarter-by-quarter totals, and point differential markets are natural products of a high-frequency scoring environment because the volume of scoring events provides enough data for meaningful within-match probability modeling.

The rule that determines how points are scored — and how often that rule can be triggered — is therefore not just a feature of the sport. It is the primary input that determines what kinds of markets are structurally viable.

Time Structure and In-Play Dynamics

How a sport manages time is the second major rule dimension that shapes market behavior, and it operates differently from scoring frequency in ways that are often underappreciated.

Continuous-time sports — football, rugby, hockey — run a clock that does not stop for most stoppages. This means that the time remaining in a match is always a meaningful variable in probability calculations, and that the real-time odds model must continuously account for the diminishing window available for scoreline changes. A team trailing by one goal with seventy minutes remaining faces a fundamentally different probability environment than the same team trailing by the same margin with five minutes left. The continuous clock makes time a live variable that interacts with every other match state input.

Stoppage-time sports — American football, basketball, baseball — manage time very differently. American football and basketball feature frequent clock stoppages that extend the practical duration of late-game sequences. A two-minute drill in American football can take fifteen minutes of real time. This characteristic creates a market dynamic where the final minutes of a match are disproportionately eventful relative to their clock-time representation, and where late-game odds behavior diverges significantly from what a simple time-remaining model would predict.

Baseball has no clock at all. Match duration is determined entirely by outs, making time-based probability modeling inapplicable in its usual form. As explored in Gwangju Insider’s detailed examination of how sport-specific rule differences flow through to market structure, the absence of a time constraint in baseball produces a market environment where momentum and sequencing variables carry more weight than they do in clock-governed sports — because there is no approaching deadline to compress probability distributions.

Roster Rules and Substitution Logic

Rules governing player participation and substitution create another layer of market complexity that varies significantly across sports. In football, the limited substitution allowance — three or four changes per match — means that the departure of a key player is a high-impact, low-frequency event that triggers immediate odds recalculation. The injury of a first-choice goalkeeper or a leading scorer is a material match-state change, and markets adjust accordingly.

In rugby league, rolling substitutions mean that player availability is a more fluid variable throughout the match. In cricket, the sequential batting structure means that the dismissal of each individual batsman is a discrete scoreline event with its own market implications. In tennis, no substitution is possible at all — the entire market rests on the performance trajectory of two individuals, making fatigue, injury signals, and psychological momentum more structurally significant than in any team sport.

These roster rules shape not just which markets are offered but how sensitively those markets must respond to personnel events during play. A sport with high substitution flexibility requires a different sensitivity model than one where the starting lineup is largely fixed.

Outcome Structures and Market Design Constraints

Perhaps the most architecturally significant way that rules shape markets is through the range of possible match outcomes. A sport that allows draws produces a three-way result market. A sport with no draw mechanism — resolved by overtime or shootout — collapses to a binary outcome but introduces additional market categories around the resolution method itself. A sport where margin of victory varies enormously produces a natural spread market. A sport where most matches are decided by narrow margins produces a different distribution of value in handicap markets.

How Draws Reshape the Entire Probability Model

The presence or absence of a draw outcome restructures the entire probability model that underlies a market. In football, all three outcomes — home win, draw, away win — must sum to certainty. The draw probability, which fluctuates with match state, continuously compresses and expands the probability space available to the two win outcomes. This three-way dynamic creates a more complex odds surface than a binary sport, and it means that in-play odds management in football requires more continuous recalibration than in sports where one team’s gain is the other team’s loss with no third possibility.

This is why direct comparisons of odds structure across sports frequently mislead. The rules governing what outcomes are possible are not background context — they are the mathematical foundation on which every probability estimate is built, as examined in Seongnam Insider’s framework for understanding how rule differences shape the structure of sports markets.

Penalty and Foul Systems

Rules governing penalties, fouls, and disciplinary events introduce a further layer of market sensitivity that is specific to each sport’s regulatory structure. In football, a penalty kick is a high-probability scoring event that dramatically shifts match odds — a penalty awarded to a trailing team late in a match is a structural discontinuity in the probability surface. In rugby, penalty kicks are more frequent and cover a wider range of positions, making them a higher-volume but lower-impact event category.

In ice hockey, power plays created by penalties alter the scoring probability environment for a defined time window rather than producing a single high-leverage event. In basketball, foul accumulation affects late-game strategy in ways — intentional fouling to stop the clock, bonus situations — that have no direct equivalent in other sports and require sport-specific modeling to price correctly.

Each of these penalty and foul systems creates a distinct category of within-match event that must be incorporated into live market logic. The rules define what the event is. The market must determine what it means for remaining outcome probabilities and price accordingly.

Why Rule Knowledge Is Market Knowledge

The implication of all of this is that understanding a sport’s rules at a mechanical level is prerequisite to understanding why its markets behave as they do. Participants who approach sports markets as generic probability exercises — interchangeable vehicles for outcome prediction — will consistently encounter market behaviors that appear arbitrary until the underlying rule structure is examined.

The odds that seem puzzling in a specific match state almost always become explicable once the rule governing that state is understood. The market type that exists in one sport but not another almost always traces back to a specific rule feature that makes it viable or unviable. The rule differences between sports are not administrative detail. They are the architecture that the entire market structure is built on top of.

Why Time-Based Sports Behave Differently

Not all sports are governed by the same underlying logic. The format of a competition — specifically, whether it is decided by the clock or by a target score — shapes everything from how teams strategize to how momentum operates to how the probability of an outcome shifts as the contest progresses. These are not superficial differences in presentation. They are structural differences in how competitive outcomes are generated.

Understanding why time-based sports behave differently from score-based formats requires examining the specific mechanisms through which the clock creates behavioral dynamics that point-race formats do not produce — and why those dynamics have direct implications for anyone trying to analyze or predict competitive outcomes accurately.

The Fundamental Structural Distinction

A time-based sport is one in which the outcome is determined by performance within a fixed duration. Football, basketball, American football, hockey, and rugby all fall into this category: play runs for a defined period, and the team with the most points at the end of that period wins. The clock is the binding constraint. Teams do not choose when the competition ends — the competition ends when the time expires, regardless of the state of the contest.

A score-based sport operates differently. Tennis, volleyball, and cricket are structured around reaching a target: a set is won when a player reaches six games, a match when they win a required number of sets. The competition ends when a threshold is achieved, not when a clock expires. The duration of the contest is variable and determined by performance itself rather than imposed from outside.

This distinction creates divergent competitive dynamics in ways that are not immediately obvious but become clearly visible in the data.

How the Clock Changes Strategic Behavior

In time-based sports, strategy is fundamentally shaped by the relationship between the current score differential and the time remaining. A team leading by two goals with ten minutes left does not face the same decision environment as a team leading by two goals with forty minutes left — even though the score differential is identical. In the first case, the rational strategy shifts toward risk management and time consumption. In the second, it may still favor open, attack-minded play.

This strategic adaptation to time-state is documented across multiple sports. Research on scoring dynamics across professional American football, basketball, and hockey found that scoring rates — the frequency with which scoring events occur — are remarkably stable across most of the playing period, following a consistent Poisson process. However, there is a significant departure from this baseline in the final moments of a scoring period, where scoring rates change markedly as teams respond to the clock pressure. This behavioral shift at the end of periods is a direct consequence of the time-based format: the clock creates an objective urgency that does not exist in score-based sports where the game continues until the target is reached.

The comeback dynamic in time-based sports is particularly distinct. As analyses of the structural differences between time-based and score-based sports and how they shape competitive outcomes document, trailing teams in time-based formats face a mathematically diminishing window in which to recover a deficit. A team down by two goals with thirty minutes remaining has three times the mathematical opportunity to equalize compared to the same team with ten minutes remaining. The declining probability of a comeback is explicit and continuously updating throughout the match — and it directly influences how the trailing team allocates risk.

The Momentum Asymmetry

Time-based sports generate a specific momentum asymmetry that score-based formats do not produce in the same way. When a team leading in a time-based sport concedes a goal, two things happen simultaneously: the score differential narrows, and the available time to rebuild the lead decreases. This compression of both the score and the clock creates pressure that is geometrically increasing rather than linear.

A team that was comfortable at 2-0 with thirty minutes remaining finds itself far less comfortable at 1-0 with twenty-five minutes remaining — even though only five minutes have elapsed. The conceded goal has changed the mathematical situation in two dimensions simultaneously. The team that scored has gained not just a goal but a change in the time-adjusted probability distribution of the final outcome.

This dynamic explains why late goals in football feel categorically different from early goals with similar score consequences. A goal in the 80th minute of a 1-0 match does not simply equalize the score — it transforms the entire probability landscape of the outcome, because the remaining time to re-establish a lead is now minimal. The clock gives every scoring event a time-dependent weight that score-based formats cannot replicate.

Clock Management as a Distinct Skill

In time-based sports, clock management becomes a competitive discipline in its own right — a category of skill that has no equivalent in score-based formats. In basketball, deliberate fouling to stop the clock is a standard late-game tactic. In football, time-wasting and tempo control are recognized tactical tools that leading teams employ systematically. In American football, the two-minute offense is a distinct tactical formation developed specifically to maximize scoring potential within a constrained time window.

None of these behaviors exist in score-based sports, because there is no clock to manage. A tennis player trailing 5-4 in the third set cannot slow the tempo to prevent the opponent from reaching their target — the structure of the contest does not allow it. The time-based format creates an entirely separate tactical dimension that athletes, coaches, and analysts must account for.

Implications for Outcome Analysis

For anyone analyzing time-based sports outcomes, the clock is not a neutral background feature. It is an active determinant of competitive behavior at every stage of the match. The probability of any given result is not static across the duration of a game — it is continuously updated by the interaction of score and time, and the behavioral adaptations that interaction produces.

A 1-0 lead at halftime in football represents a very different probability state from a 1-0 lead with five minutes remaining — even though the score is identical. The remaining time determines how much of the variance space for potential outcomes remains open, and the strategic behaviors of both teams will reflect that calculation in ways that directly influence what subsequently happens on the field.

Understanding that the clock and the scoreline are two co-determining variables — not the scoreline alone — is the foundational analytical adjustment required for working with time-based sports accurately.

Final Thoughts

Time-based sports behave differently because the clock creates a continuously evolving probability landscape, generates strategic behaviors tied to the time-state of the contest, and gives scoring events a time-dependent weight that fundamentally shapes how competitive dynamics unfold. These are not incidental features of the format. They are the core mechanisms through which time-based competition produces different behavioral patterns from score-based alternatives.

Analyzing them as if they were the same produces predictably inaccurate assessments of how outcomes develop.

The scoreline tells you where the game is. The clock tells you what it means.

Why Gambling Regulations Differ Across Cultures and Regions

Few industries illustrate the diversity of human values, political priorities, and historical experiences quite as vividly as gambling regulation. In one country, a national lottery is a civic institution. In another, placing a sports wager carries criminal penalties. Across a single continent, neighboring nations can hold diametrically opposite legal positions on the same activity. And even within a single country, the regulatory picture can fragment dramatically from one state or province to the next.

This divergence is not accidental. The way any society chooses to govern gambling — whether through prohibition, licensing, taxation, or tolerance — reflects a complex interplay of cultural attitudes, religious traditions, economic ambitions, and political history that cannot be reduced to a single explanation. As explored in regional analyses of global gambling regulation frameworks, the structural differences between legal models run far deeper than surface-level policy choices. Understanding why gambling regulations differ across cultures and regions requires examining each of these dimensions and how they interact over time.

The Cultural and Religious Foundation of Gambling Law

The most fundamental driver of regulatory divergence is cultural attitude toward gambling itself — and cultural attitudes are inseparable from religious tradition.

In predominantly Islamic countries, gambling is prohibited outright. The Quran explicitly identifies gambling as a form of harm that outweighs its benefit, and this religious prohibition translates directly into legal prohibition across most of the Muslim world. Saudi Arabia, Iran, Pakistan, and the vast majority of Middle Eastern and North African nations maintain comprehensive bans on gambling activity. The law is not simply regulating an industry — it is expressing a moral position that has deep roots in the foundational texts and community values of the society.

In contrast, many Buddhist and Hindu traditions take a more ambivalent view of gambling. While excessive gambling is discouraged as a cause of suffering, the activity itself is not categorically forbidden. This creates cultural space for regulation rather than prohibition, and the legal frameworks of countries like Thailand, India, and Cambodia reflect this nuance — even if they remain complex and sometimes contradictory.

In largely secular Western societies, the cultural framing has shifted further. Gambling is increasingly understood as a form of entertainment — a consumer activity that, like alcohol or tobacco, carries risks that can be managed through licensing, age verification, and responsible gambling tools rather than outright prohibition. This framing enables the kind of sophisticated regulatory infrastructure seen in the United Kingdom, Sweden, the Netherlands, and Germany, where licensed operators function within detailed legal frameworks designed to protect consumers while generating tax revenue.

These different starting points — moral prohibition, cautious tolerance, and managed liberalization — produce regulatory systems that are structurally incompatible with each other, even when the gambling activities being governed are identical.

Economic Incentives and the Revenue Argument

Regardless of cultural starting point, the economic argument for regulated gambling has become increasingly difficult for governments to ignore. The global online gambling market was projected to reach USD 101.45 billion in 2026, up from USD 91.63 billion in 2025, growing at a compound annual rate of 10.72% through 2031. That scale of economic activity generates tax revenue, employment, and tourism spending that many governments find compelling.

This economic incentive is one of the primary forces driving regulatory change in regions that once maintained stricter positions. New Zealand passed legislation in July 2025 permitting up to 15 licensed online casino operators — a historic shift for a country that had previously confined regulated gambling to the state-owned platform. The government’s reasoning was explicit: most New Zealanders who wished to gamble online were already doing so through offshore platforms that provided no domestic economic benefit and little player protection. Regulated markets, the argument goes, are safer markets — and they generate revenue that prohibition simply loses to the grey economy.

Brazil’s 2025 regulatory framework tells a similar story at far greater scale. The country’s comprehensive new licensing system — covering sports wagering, online casinos, and lottery products — imposed a 12% tax on gross gaming revenue while establishing the region’s most detailed responsible gambling requirements. The framework represented years of legislative effort and reflected a judgment that the Brazilian market, already enormous in practice, would be better served by formal regulation than continued informal operation.

This pattern — of prohibition giving way to regulation as governments recognize the practical limits of enforcement and the economic costs of exclusion — repeats across regional contexts and across decades of gambling policy history.

Political Structure and the Fragmentation of Regulation

In federated political systems, gambling regulation becomes further complicated by the distribution of legislative authority between central and regional governments. The result is regulatory fragmentation that can produce dramatically different legal environments within a single country’s borders.

The United States is the most prominent example. Following a 2018 Supreme Court ruling that struck down a federal prohibition on sports betting, each state has developed its own regulatory framework independently. New Jersey, Pennsylvania, and Michigan operate sophisticated licensed markets with robust responsible gambling requirements and digital verification systems. Other states have expanded land-based gambling without permitting online wagering. Some states have not moved at all. The result is a patchwork of overlapping and sometimes contradictory legal environments that operators, players, and regulators must navigate simultaneously.

Canada operates similarly, with provincial agencies like iGaming Ontario establishing licensed online markets while other provinces maintain more restrictive frameworks. Germany has attempted to harmonize regulation through a national Interstate Treaty but continues to manage significant variation in implementation across its sixteen federal states.

This fragmentation is not merely administrative inconvenience. It reflects genuine political disagreement about who should govern gambling — local communities with specific cultural contexts, or national governments with broader economic and public health mandates. Different answers to that question produce different regulatory architectures, and those architectures shape the gambling experience of everyone who lives within them.

The Global Regulatory Tightening Trend of 2025–2026

Against this background of persistent diversity, a clear directional trend has emerged in 2025 and 2026: regulators across most jurisdictions are tightening their frameworks, regardless of their starting positions.

In Europe, responsible gambling has shifted from a customer service expectation to a data compliance obligation. Operators in Germany, the Netherlands, the UK, Spain, and Sweden are required to track gameplay sessions, transaction behavior, and affordability indicators — and to intervene automatically when behavioral patterns suggest risk. Central self-exclusion systems allow players to block access across all licensed operators simultaneously. Advertising faces increasing restrictions, with Croatia’s 2026 reforms banning gambling ads during most daytime hours.

In Asia, the picture remains varied. Most Asian nations maintain strict prohibition or high regulation due to cultural attitudes and concerns about addiction and crime. Japan legalized integrated resort casinos in principle but has proceeded extremely cautiously with implementation. The Philippines has taken a different path, actively developing its regulatory framework and positioning itself closer to international standards — reflecting both its young, tech-savvy population and its strong mobile and payment infrastructure.

In Latin America, Brazil’s entry into the regulated market has established a new regional benchmark. The framework enforces strict advertising standards protecting minors, centralized self-exclusion platforms, mandatory partnerships with local entities, and rigorous financial supervision. Colombia, Peru, and Panama have introduced comparable systems, suggesting that Latin America is moving toward a more standardized regional approach even as country-level specifics remain distinct.

Why Uniform Global Regulation Remains Unlikely

Given these pressures toward convergence, it is worth asking why global gambling regulation has not become more standardized. The answer returns to the cultural and political foundations that drive regulatory divergence in the first place.

Gambling regulation is not purely a technical exercise in risk management. It is an expression of what a society values, what it fears, and how much it trusts its citizens to make consequential decisions for themselves. Those values differ fundamentally across cultures, and legal systems exist to give those values formal expression. A regulatory framework that reflects the priorities of a secular, liberal democracy is not simply transferable to a society governed by religious law or a federal system with strong traditions of local sovereignty.

There is also a practical dimension. As the DLA Piper 2026 global gambling law guide notes, regulatory expectations are hardening across jurisdictions while disputes are becoming a growing business risk — a combination that reflects the increasing complexity rather than simplification of the global regulatory environment. Markets that once operated in a grey zone are being formalized, but formalization takes the shape of local legal tradition rather than international template.

What This Means for Operators, Players, and Researchers

For anyone engaging with gambling markets across national boundaries — whether as an operator seeking licenses, a player accessing platforms, or a researcher studying the industry — the regulatory diversity documented in this article has direct practical implications.

Operators cannot assume that compliance in one jurisdiction confers any protection in another. Responsible gambling regulations continue to evolve across Europe, with common tools such as exclusion registers, deposit limits, and behavioral monitoring increasingly introduced — though their implementation depends on national legislation. Each market requires independent compliance assessment, and the cost of that assessment is substantial. The trend toward tighter regulation in most markets means that compliance costs are rising, and operators who treat regulatory differences as opportunities to exploit rather than frameworks to respect face growing enforcement risk.

For players, regulatory diversity means that the protections available depend heavily on jurisdiction. A player accessing a platform licensed in a well-regulated market benefits from age verification, deposit limits, self-exclusion tools, and recourse mechanisms that simply do not exist on an unlicensed platform. Understanding where a platform is licensed — and what that license actually requires — is one of the most practically important pieces of information any player can have.

Final Thoughts: Regulation as Cultural Expression

Gambling regulation is, at its core, a form of cultural expression. The rules a society establishes for how gambling is permitted, taxed, advertised, and constrained reflect that society’s understanding of risk, freedom, economic opportunity, and moral responsibility.

That expression differs across cultures because cultures differ. The divergence will not disappear as the industry globalizes — if anything, the increasing economic significance of gambling markets is making regulatory questions more politically salient, not less. Nations that might once have tolerated informal gambling activity are now making deliberate choices about whether and how to regulate it, and those choices are being made through the lens of local values and priorities.

Understanding why those choices differ is not just an academic exercise. It is the starting point for anyone who wants to engage intelligently with one of the most culturally revealing policy arenas in the contemporary world.

The way a society governs gambling reveals more about its values than almost any other regulatory domain. The diversity of those rules is a mirror held up to human difference itself.

Why Systems Feel Rigged at the Beginning

Almost everyone who has entered a new competitive system — a sports market, a trading platform, a ranked game environment, a professional hierarchy — has experienced a version of the same feeling early on: that the system is not neutral, that outcomes are skewed against newcomers, and that the rules seem designed to benefit those who already know how to navigate them.

Sometimes that feeling is correct. But far more often, why systems feel rigged at the beginning has less to do with the system itself and more to do with the predictable cognitive distortions that beginners bring to any new environment — distortions that make genuinely neutral systems appear unfair, and that make early losses feel like evidence of manipulation rather than the expected output of limited experience.

The Newcomer’s Disadvantage Is Real — But Misattributed

There is a legitimate asymmetry facing anyone entering an established system. Experienced participants have developed pattern recognition, calibrated intuitions, and contextual knowledge that newcomers have not yet built. In most competitive environments, this produces a predictable early-stage outcome: beginners lose more than they win.

That much is real. What is misattributed is the cause. Beginners who experience early losses consistently tend to attribute those losses to external factors — unfair design, rigged outcomes, system manipulation — rather than to the actual cause, which is the straightforward skill and knowledge gap between themselves and more experienced participants. This is a textbook instance of what psychologists call the self-serving bias: the well-documented tendency to attribute successes to internal factors (skill, judgment, effort) and failures to external ones (bad luck, unfair conditions, rigged systems).

The self-serving bias is not a character flaw — it is a near-universal feature of human cognition, identified across decades of behavioral research. Athletes attribute wins to their own skill and losses to bad calls. In competitive markets, new entrants attribute early losses to market manipulation rather than informational disadvantage. The attribution is wrong, but the cognitive mechanism producing it is both consistent and deeply rooted.

Loss Aversion Amplifies the Feeling

The perception of unfairness at the start of any new system is further amplified by loss aversion — the well-established asymmetry in how gains and losses are psychologically experienced. Research consistently shows that the emotional impact of a loss is roughly twice as powerful as that of an equivalent gain. A newcomer who experiences three early losses and two early wins does not feel neutral. They feel behind, frustrated, and suspicious — because the losses have registered with twice the emotional weight of the wins.

As analyses of why well-functioning systems feel unfair to those inside them document, this asymmetry creates a persistent perceptual distortion: systems that are statistically balanced produce subjective experiences of imbalance, because negative outcomes are felt more intensely than positive ones regardless of their equal frequency.

For a newcomer in the early stages of any system, the combination of an actual skill gap and a perceptual amplification of losses creates an experience that feels distinctly rigged — even when the system is operating exactly as designed.

The Reference Point Problem

Another contributing factor is the newcomer’s reference point. Beginners typically enter a system with expectations shaped by observation of expert-level performance — they have watched experienced participants operate and formed an implicit model of what outcomes should look like. When their own early outcomes fail to match that model, the gap feels like evidence of systemic unfairness rather than what it actually is: the difference between watching something and being able to do it.

This reference point mismatch is compounded by the Dunning-Kruger dynamic, in which early-stage participants tend to overestimate their own competence because they do not yet have enough knowledge to accurately assess how much they do not know. A 2025 PMC study on overconfidence biases in young decision-makers found that participants reported an average confidence of 57% in their predictions but achieved only a 35% accuracy rate — a gap that produces repeated unexpected failures and, predictably, a sense that external factors must be interfering with what should have been correct outcomes.

What Fair Systems Actually Look Like From the Inside

The deeper problem is that fair systems and rigged systems often feel identical to a newcomer who is losing. Both produce a pattern of early losses. Both generate frustration. Both create the sensation of operating at a disadvantage. The distinguishing factor — whether the losses reflect a skill gap or a structural imbalance — is not visible from inside the early experience itself.

This is why the feeling of being in a rigged system is not reliable evidence that the system is actually rigged. It is reliable evidence that losses are occurring — but the cause of those losses requires analysis that the emotional state of early failure makes genuinely difficult to access.

The more productive frame for anyone entering a new system is to treat early losses as data about the learning curve rather than evidence about the system’s fairness. That reframe does not make the losses less frustrating. But it directs attention toward the one variable that the participant can actually change — their own level of understanding — rather than toward a structural complaint that, in most cases, misdiagnoses the actual problem.

Systems feel rigged at the beginning primarily because beginning is hard, losses feel worse than gains feel good, and the mind reliably attributes external causes to uncomfortable outcomes. Understanding this does not eliminate the experience — but it does clarify what it actually means, and what to do about it.

The system is not always fair. But the feeling that it isn’t is almost always the worst possible guide to whether it is.

How Technology Transformed Betting Systems Without Changing Human Behavior

The infrastructure of sports wagering has changed beyond recognition in the past two decades. What once required a physical trip to a licensed bookmaker, a handwritten slip, and a wait until the following morning for results now happens in milliseconds on a device that fits in a shirt pocket. Odds update in real time. Live wagering adjusts to every play. AI-driven platforms process thousands of data points simultaneously and offer personalized recommendations before the user has finished reading the match summary.

The systems have been transformed. The humans using them have not. Understanding how technology transformed betting systems without changing human behavior reveals something important about the limits of technological progress — and why the most sophisticated platform in the world cannot protect a user from the cognitive patterns they brought to it.

What Technology Actually Changed

The technological transformation of wagering platforms is real and substantial. Modern systems can reach 75–85% accuracy in predicting game outcomes across major sports, compared to the 50–60% ceiling that traditional statistical models typically achieved. AI processes injury data, weather conditions, real-time game feeds, and historical performance across thousands of variables simultaneously — a scope of analysis no human analyst can replicate.

On the operational side, automation has reshaped how odds are set and updated. Algorithms now adjust live odds within milliseconds of in-play events, reducing sportsbook exposure to arbitrage while offering users a far richer range of live markets than any manually-operated system could sustain. Mobile applications have embedded access into daily life — the global sports wagering market reached $110.31 billion in 2025, driven substantially by smartphone adoption and the removal of physical barriers to participation.

As explored in analyses of how mobile-first digital experiences have become part of everyday life, the shift to always-on digital access has fundamentally changed the relationship between users and platforms across virtually every industry — and wagering is among the most affected. Placing a wager is no longer an event requiring deliberate preparation. It is something that can happen between two thoughts, with three taps, at any hour.

What Technology Did Not Change

Against the scale of this transformation, the continuity of human cognitive behavior is striking. The same patterns that shaped decisions made in a physical bookmaker’s shop in 1995 are present in the behavior recorded on AI-optimized platforms in 2026.

Confirmation bias leads users to overvalue information that supports their existing beliefs about a team or outcome, and to discount contrary evidence — regardless of how much data the platform has provided. Recency bias causes disproportionate weight to be placed on the last few results, even when a larger sample would tell a different story. The gambler’s fallacy — the belief that a sequence of outcomes influences the probability of the next independent event — persists in digital environments with the same force it had in analog ones.

Loss chasing is perhaps the most consequential of these patterns. Research consistently documents the tendency to increase stake sizes after losses in an attempt to recover ground, a behavior that compounds risk rather than reducing it. Technology has not diminished this pattern. In some respects, it has amplified it: the speed and accessibility of mobile platforms mean that the impulse to chase can be acted upon immediately, without the natural friction of having to travel somewhere or wait for a market to open.

A 2025 study from the Gwangju Institute of Science and Technology demonstrated this continuity in a particularly pointed way — testing large language models in simulated wagering environments and finding that even AI systems trained on vast datasets replicated the same cognitive distortions documented in human behavior: loss chasing, illusion of control, and the gambler’s fallacy all appeared in machine decision-making that had absorbed human behavioral patterns from training data.

The Asymmetry at the Center

This creates a fundamental asymmetry. The platform side of the wagering equation has been optimized by technology to an extraordinary degree — faster, more accurate, more personalized, and more continuously available. The user side operates on the same cognitive architecture it always has, with the same vulnerabilities, the same biases, and the same susceptibility to the emotional dynamics that technology has made more accessible rather than less.

Personalization algorithms may even deepen this asymmetry. Research published in a 2025 PMC study on AI personalization in online platforms found that adaptive reward structures and targeted retention strategies can reinforce the illusion of control and strengthen loss aversion — exploiting the precise psychological mechanisms that most reliably sustain continued engagement regardless of outcomes.

What This Means for Users

Recognizing this asymmetry does not require dismissing the genuine value that better information and more sophisticated tools provide. It requires understanding that tools operate within a human context — and that no amount of data quality or interface refinement changes the cognitive equipment the user brings to the decision.

The most important variable in how any wagering decision turns out is not the sophistication of the platform delivering the odds. It is whether the person making the decision is engaging with those odds through deliberate analysis or through the reactive, emotionally-driven patterns that technology has made easier to act on than at any previous point in history.

Technology changed what is possible. It did not change how the mind works.

Better systems do not produce better decisions. Better decisions require something technology cannot supply — awareness of the mind using it.

Why Technology Rewards Reaction Over Reflection

There is a persistent assumption that more information leads to better decisions. The digital environment delivers information faster and in greater volume than any previous era in human history — real-time data, instant alerts, live updates, and continuous feedback streams are now the default conditions under which most people make decisions involving money, time, and attention.

Yet the evidence from behavioral research tells a more complicated story. Speed and volume of information do not reliably improve decision quality. In many contexts, they actively undermine it. The reason lies in a fundamental asymmetry between how modern technology is designed and how human cognition actually works. Understanding why technology rewards reaction over reflection requires looking carefully at that asymmetry — where it comes from, how it operates, and what it means for anyone navigating high-stakes decisions in a fast-moving digital environment.

The Architecture of Fast and Slow Thinking

Nobel Laureate Daniel Kahneman’s framework of System 1 and System 2 thinking has become one of the most widely applied models in behavioral science, and for good reason — it describes something real and measurable about how human cognition operates under different conditions.

System 1 is fast, automatic, and emotionally driven. It operates below the threshold of conscious deliberation, generating instant responses based on pattern recognition, past associations, and heuristic shortcuts. It is the system responsible for the immediate gut reaction — the instant read of a situation before any deliberate analysis has occurred.

System 2 is slow, deliberate, and analytically demanding. It engages consciously, works through logical sequences, and is capable of overriding System 1’s initial responses — but only when the individual is motivated and has the cognitive space to engage it. System 2 is mentally taxing. It requires effort, time, and relative freedom from pressure.

The critical insight from this framework is not that System 1 is bad and System 2 is good. System 1 handles the vast majority of everyday decisions competently and efficiently. The problem arises when high-stakes decisions that genuinely require System 2 analysis get made instead under System 1 conditions — when time pressure, emotional arousal, and information velocity push the mind into fast-reaction mode at precisely the moments when slow deliberation would produce better outcomes.

This is exactly what modern technology is systematically designed to do.

How Technology Is Designed to Activate System 1

Digital platforms are not neutral delivery mechanisms for information. They are purpose-built environments whose architecture shapes user behavior in specific and often deliberately chosen directions. The design choices that define these environments — notification timing, visual feedback design, real-time data presentation, loss-framing alerts — consistently create conditions that favor System 1 processing over System 2 deliberation.

Real-time feedback is the most fundamental mechanism. When a platform updates continuously — showing live price movements, live score changes, live engagement metrics, live odds — it creates an environment in which the situation is always changing and the implicit demand to respond is always present. A static number on a screen invites analysis. A number that is visibly moving in real time invites reaction. The psychological response to motion and change is automatic and immediate, routed through System 1 before any deliberate evaluation can begin.

Notification design operates through the same mechanism. Notifications are designed to interrupt — to create a sudden shift in attention that bypasses whatever deliberative process was in progress and redirects cognitive resources toward an immediate stimulus. The interruptive quality of a notification is not incidental to its function; it is the function. A notification that allowed the recipient to finish their current thought and respond later at a time of their choosing would lose most of its behavioral influence.

Loss framing, another ubiquitous design pattern, exploits the well-documented asymmetry in how humans experience potential gains versus potential losses. Research in behavioral economics consistently shows that the psychological impact of a potential loss is roughly twice as powerful as an equivalent potential gain. Platforms that frame their real-time updates in terms of what can be lost — by inaction, by hesitation, by not responding immediately — are specifically targeting the emotional reactivity of System 1 to override the more measured analysis of System 2.

Fast Feedback and Emotional Volatility

As research on the relationship between fast feedback and emotional volatility documents, the speed of feedback cycles has a direct effect on emotional stability — and by extension, on decision quality. When feedback arrives slowly, there is time for emotional responses to settle before the next decision point. When feedback arrives continuously, emotional states are in constant flux, and decisions get made against an unstable emotional background rather than a settled one.

This dynamic is particularly consequential in contexts where decisions have cumulative effects. A single reactive decision made in a moment of emotional volatility may have limited consequences. A pattern of reactive decisions, made repeatedly under conditions of continuous fast feedback, accumulates into an outcome that careful deliberation would never have produced. The technology does not cause a single bad decision — it creates the conditions under which reactive patterns become habitual.

The habitual dimension is important. Research on System 1 and System 2 thinking suggests that the two systems are not static — over time, patterns of behavior gradually shift from System 2 processing to System 1 automaticity. Activities that initially require deliberate effort become, with repetition, automatic responses. This means that environments that consistently reward reactive behavior are not just producing individual reactions — they are gradually reshaping the cognitive habits through which users process all future situations of the same type.

The Information Overload Paradox

One of the most counterintuitive findings in decision research is that more information does not reliably improve decisions — and beyond a certain threshold, additional information actively degrades decision quality. This finding runs directly against the intuitive assumption that better-informed decisions are always better decisions.

The mechanism is cognitive load. System 2, the deliberative system, has finite capacity. When the volume and velocity of incoming information exceeds that capacity, the mind does not simply process more slowly — it defaults to System 1 heuristics to manage the excess. More information, presented faster, does not produce more analysis. It produces less, because the cognitive resources required for analysis are overwhelmed before they can engage.

Digital platforms in high-information-density environments present data at a pace that systematically exceeds System 2’s processing capacity. Live dashboards showing dozens of simultaneously updating variables, notification streams carrying new data points every few seconds, and interface designs optimized to present maximum information in minimum screen space are all features that increase information density beyond the threshold at which deliberative processing remains possible.

The paradox resolves itself when the design intent is understood. Platforms that present more information faster are not trying to improve their users’ analytical capabilities. They are creating conditions in which analytical deliberation becomes impractical, and reactive engagement — which generates activity, transactions, and engagement metrics — becomes the path of least resistance.

The Role of Dopamine in Reactive Decision-Making

The neurological dimension of this problem runs deeper than cognitive architecture. Affective cognition — the emotional, System 1-type thinking — is located primarily in the mesolimbic dopamine reward system. This pathway is responsible for the release of dopamine, the neurotransmitter most associated with anticipation, reward, and motivated behavior. Human beings are biologically wired to seek immediate gratification in part because dopamine release is triggered by the anticipation of reward, not just its receipt.

Digital platforms that provide variable, unpredictable rewards — the social media post that might get a hundred responses or none, the live odds that might move favorably in the next second, the notification that might carry good news or bad — are exploiting this biological mechanism. Variable reinforcement schedules are the most powerful drivers of habitual behavior identified in behavioral psychology, and they produce engagement patterns that are effectively compulsive: checking, refreshing, monitoring, reacting, in a loop that the deliberative mind did not consciously choose and often cannot easily exit.

The dopamine pathway also explains why fast feedback feels rewarding even when it is not objectively useful. The experience of receiving an immediate response to an action — a notification, a result, an updated figure — generates a mild dopamine response regardless of whether the content of that response is positive or negative. The speed of the feedback is itself reinforcing, independent of what the feedback says. This is why continuous real-time environments feel engaging and why slower, more information-sparse environments often feel frustrating even when they are analytically superior.

Reflection as a Cognitive Skill That Requires Conditions

If reaction is the default response to fast-moving digital environments, reflection requires conditions that those environments systematically deny. Reflection requires time — not just the absence of immediate pressure, but a genuine interval in which the initial emotional response can settle and deliberate analysis can begin. It requires cognitive space — freedom from the competing demands of continuous notifications and real-time updates. And it requires what behavioral scientists call psychological distance — the ability to evaluate a situation from a perspective that is not dominated by the immediate emotional state it provokes.

None of these conditions are provided by platforms designed to maximize engagement through continuous stimulation. The most practically significant implication of this is that reflection, in a high-stimulation digital environment, becomes a skill that must be actively cultivated rather than a default mode that technology supports. The platform will not pause to allow deliberation. The data will not slow down to give analysis time to complete. The notification will not wait until a reflective frame has been established.

The individual who wants to make better decisions in these environments must create the conditions for reflection themselves — by choosing when to engage with fast-moving information, by establishing deliberate pauses before acting on emotionally charged stimuli, and by recognizing the situations in which System 1 reaction is being solicited at precisely the moment when System 2 deliberation is most needed.

What This Means in Practice

The practical implications extend across any domain in which digital platforms mediate high-stakes decisions. Financial markets, sports analytics tools, real-time operational dashboards, and any platform that presents live-updating data with implicit or explicit prompts to act all create the conditions described in this article.

Recognizing those conditions is the first step toward managing them. The question to ask upon encountering real-time data with an implicit urgency attached to it is not “what does this number mean right now” but “what are the conditions under which I am being asked to interpret this number” — specifically, whether those conditions are designed to support careful analysis or to elicit immediate reaction.

Poorly designed feedback systems pose serious ethical risks, including manipulation and distorted decision-making. When feedback misleads by exaggerating urgency, hiding consequences, or using interface patterns that create false time pressure, it erodes the quality of the decisions made within those environments. Recognizing these patterns as design choices — not inevitable features of the digital world — is the beginning of engaging with them on more deliberate terms.

Final Thoughts: Speed Is a Design Choice

The environment that rewards reaction over reflection did not emerge accidentally. It was designed, iteratively refined, and optimized through A/B testing and behavioral data to produce engagement patterns that serve platform interests. The speed is not incidental — it is the mechanism. The urgency is not organic — it is manufactured.

This does not mean that digital platforms are simply adversarial. Many of the same principles that make them reactive can be redirected toward reflection — feedback loops that surface consequences rather than just outcomes, interface designs that slow down rather than accelerate high-stakes decisions, alert systems that distinguish between genuinely time-sensitive information and information that merely benefits from feeling urgent.

But that redirection requires understanding what the current design is actually doing to the people who use it — and making deliberate choices about when to engage with it on its own terms and when to step back, create distance, and allow the slower, more demanding, more reliable system to do its work.

Reaction is what technology is built for. Reflection is what good decisions require. The gap between them is where most consequential errors are made.